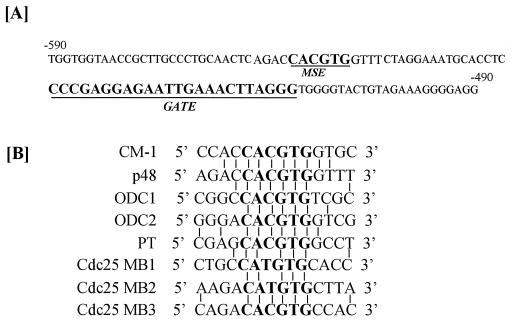
Figure 3.
Analysis of MSE of murine p48 promoter. (A) Relative positions of GATE and MSE in the promoter region corresponding to −490 to −590 bases. (B) Comparison of MSEs from various cellular genes and their relationship to consensus MSE, CM-1. ODC, ornithine decarboxylase; PT, prothymosine; cdc25: CDK activating phosphatase A gene. Vertical line indicates identity with CM-1. Core MSE is shown in bold letters.

