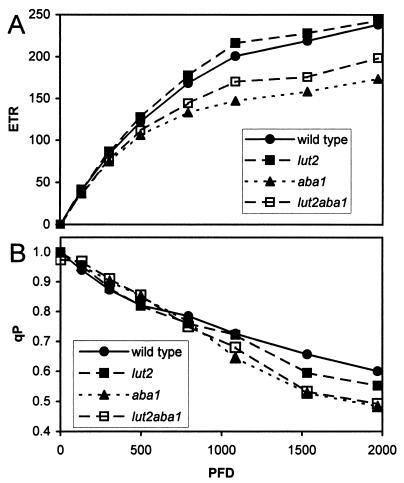
Figure 4.
Light response curves of wild-type, lut2, aba1, and lut2aba1 lines were used to calculate the electron transport rate, ETR (A), and photochemical quenching, qP (B). The photosynthetic activity radiation intensities of 0, 132, 304, 499, 794, 1,087, 1,533, and 1,971 μmol⋅m−2⋅sec−1 were applied for 10 min. The fluorescence measurements, Fs and Fm′ values (light), and the Fo′ value (recorded in dark immediately after each step) were used to calculate the ETR and qP.

