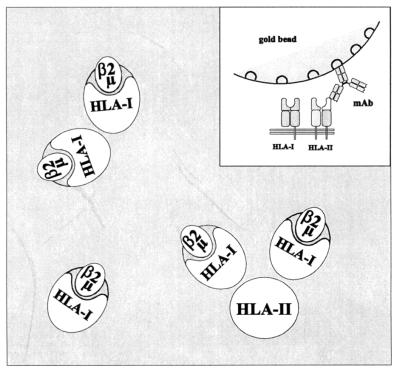
Figure 3.
Two-dimensional schematic model of the proximity relationships among HLA class I and class II molecules on the surface of JY cells as predicted by the fluorescence energy transfer data of Table 2. The complexes shown indicate a possible topographical arrangement of the receptors. (Inset) Schematic vertical model of immunogold bead attachment to the HLA class II. The bead covers the co-clustered class I molecule(s) as predicted by energy transfer using site-specific labels. The quantity of the heteroclusters shown on the picture is calculated as BA in the equations.

