
Figure 4.
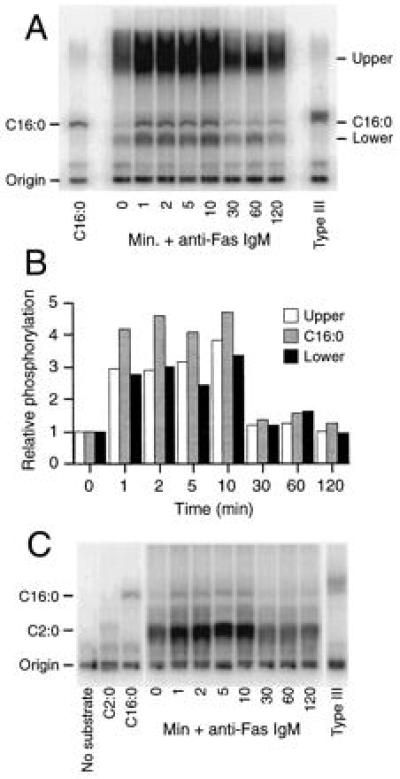
Evaluation of the DAGK assay for determination of cellular ceramide levels. Cellular lipids were generated, and the DAGK assay was performed as described in Experimental Procedures. For A and C, stimulations were either performed at 1 × 10⁷ cells/ml and 250 ng/ml CH-11 in 1 ml for 1, 2, 5, and 10 min time points or at 2 × 10⁶/ml and 100 ng/ml CH-11 in 5 ml for 30, 60, and 120 min time points. Phospholipids were visualized by TLC and phosphorimaging following the DAGK assay, which was performed in the absence (A) or presence (C) of 200 nmol C2:0 ceramide as an internal standard. C2:0 (200 nmol), C16:0 (200 nmol), and Type III (30 μg) ceramides were included as controls where indicated, along with one in the absence of any added substrate in C. (B) Quantitative analysis of the three major generated phospholipid species (bands labeled C16:0, Upper and Lower) observed in A was performed on a PhosphorImager. Data presented are mean values for three separate quantitations made of the same exposure to reduce variations introduced due to differences in the precise regions selected for integration. Standard deviations in all cases were <20% of values shown (data not shown).