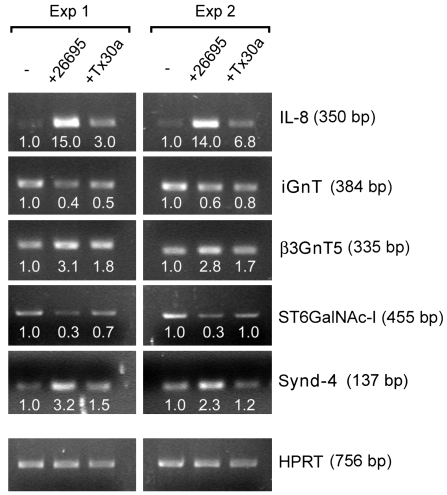
Figure 2. RT-PCR confirmation of mRNA expression of selected genes in uninfected MKN45 cells (–) or infected with either high-Hp or low-Hp.
Two independent experiments are shown (Exp. 1 and Exp. 2). Densitometry was performed on gel bands using Quantity One software (BioRad) and normalized to expression of the HRPT gene. Values are presented below each gel band as fold increase relative to the respective control (–).

