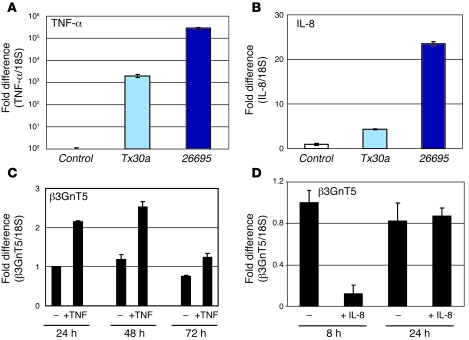
Figure 4. Cytokine expression and β3GnT5 induction.
Analysis by real-time PCR of mRNA expression of TNF-α (A) and IL-8 (B) in MKN45 cells without Hp (control) or infected with low-Hp or high-Hp strains. Real-time PCR of β3GnT5 mRNA expression after 24 h, 48 h, and 72 h in the absence (–) or presence of 40 ng/ml TNF-α (C) or after 8 h and 24 h in the absence or presence of 50 ng/ml IL-8 (D). Real-time PCR reactions were performed in triplicate. Target gene expression levels were normalized to 18S expression levels, and results are presented as fold differences compared with untreated cells.

