
Figure 2.
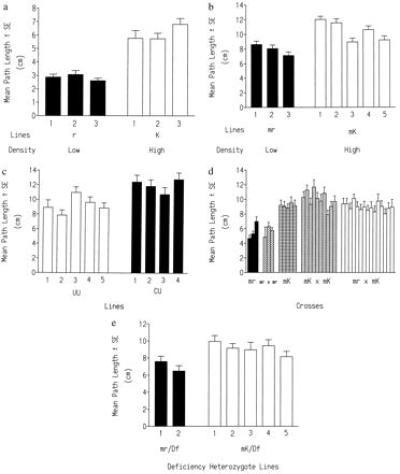
(a) Mean ± SE larval path lengths for the three low-density- (r) and high-density-selected (K) lines. The low-density lines had significantly shorter path lengths than the high-density lines (nested ANOVA, F(1, 4) = 74.5, P < 0.0001; Student–Neuman–Keuls, P = 0.05). Sample sizes ranged from 43 to 53 larvae per line. (b) Mean ± SE larval path lengths for the independently selected replicate low-density (mr) and high-density (mK) lines (n = 40 per line). The low-density mr lines had significantly shorter path lengths than the high-density mK lines (nested ANOVA, F(1, 6) = 8.3, P < 0.05). (c) Mean ± SE larval path lengths for the five UU (low larval and low adult density) and the four CU (high larval and low adult density) lines. UU lines had significantly lower path lengths than CU lines (nested ANOVA, F(1, 7) = 15.25, P < 0.01). (d) Mean ± SE larval path lengths of the mr, mr × mr, mK, mK × mK, and mK × mr crosses. Crosses made with mK lines had significantly higher path lengths than those with mr lines alone (see text). (e) Mean ± SE larval path lengths of the two mr/Df and the five mK/Df heterozygotes (17 < N < 39). Df stands for Df(2L)edSz. The recessive short path-length phenotype found in the mr lines is uncovered by this deficiency. The differences between the mr and mK lines were significant (nested ANOVA, F(1, 7) = 15.25, P < 0.01).