
Figure 2.
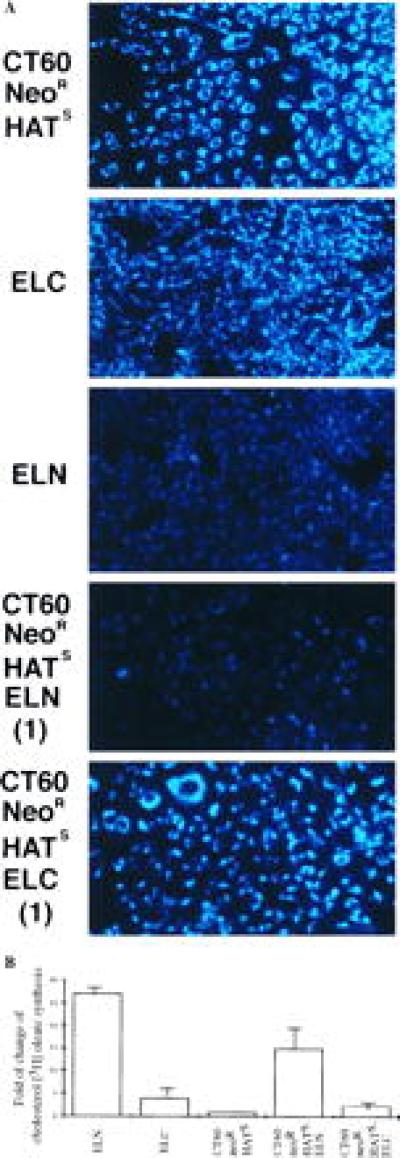
(A) Filipin staining of unesterified cholesterol in response to LDL uptake, in CT60 neoR HATS, ELN, ELC, and two of the cell fusion-derived clones. The intense staining in CT60 neoR HATS and ELC cells and the CT60 neoR HATS–ELC (1) fusion clone has the perinuclear pattern of lysosomal distribution seen in NP-C (ELC), but not in normal cells (ELN). Clone identification numbers are indicated in parentheses. (B) Stimulation of [3H]oleic acid incorporation into esterified cholesterol oleate in ELN, ELC, CT60 neoR HATS, and CT60 neoR HATS–ELN/ELC fusion-derived cells. The mean fold of change in [3H]cholesterol oleate synthesis is plotted for the unfused cell lines, each assayed in triplicate. For each heterokaryon type, the mean fold of change was calculated from three clones, each assayed in triplicate. SD are: ELN:1.15, ELC:1.64, CT60 neoR HATS:0.33, CT60 neoR HATS–ELN:4.50, and CT60 neoR HATS–ELC:1.01.