
Figure 4.
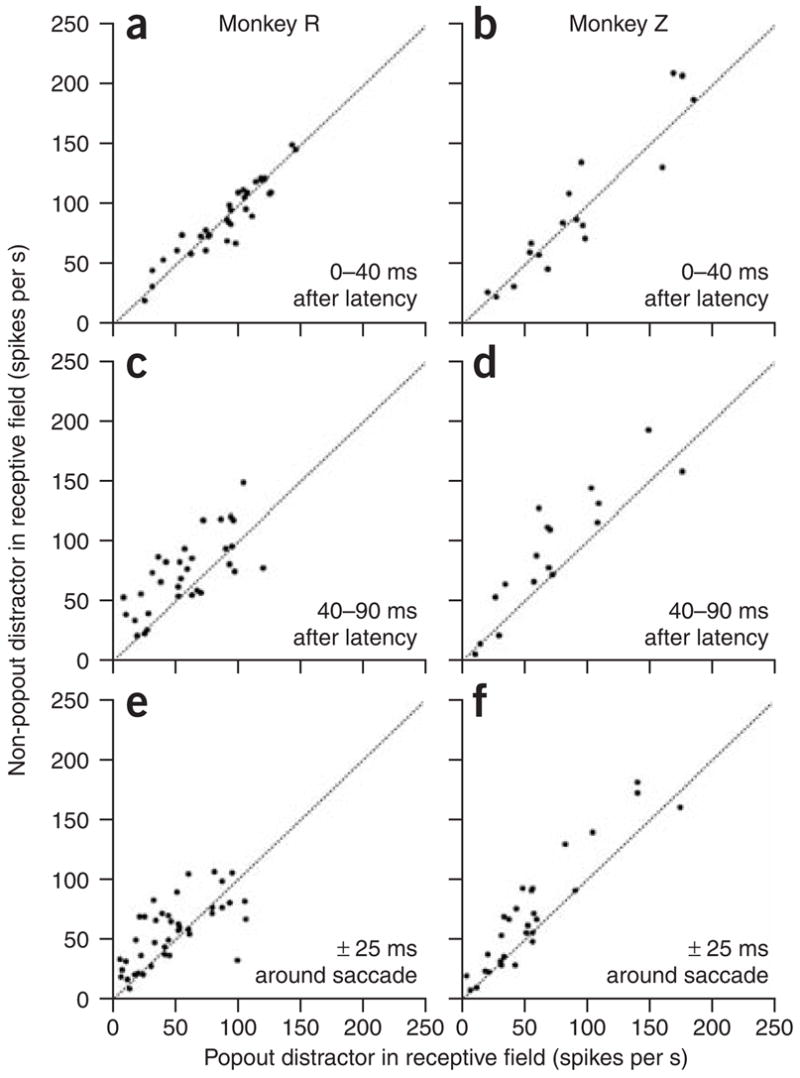
Response to popout and non-popout distractors in three epochs of the trial for each monkey. (a,b) The response of each cell to the non-popout distractor is plotted against the response of the same cell to the popout distractor in the first 40 ms after the latency. (c,d) The responses in a 50-ms epoch after the first response, plotted as in a. (e,f) The responses in the interval ± 25 ms around saccade onset, plotted as in a.