
Fig. 10.
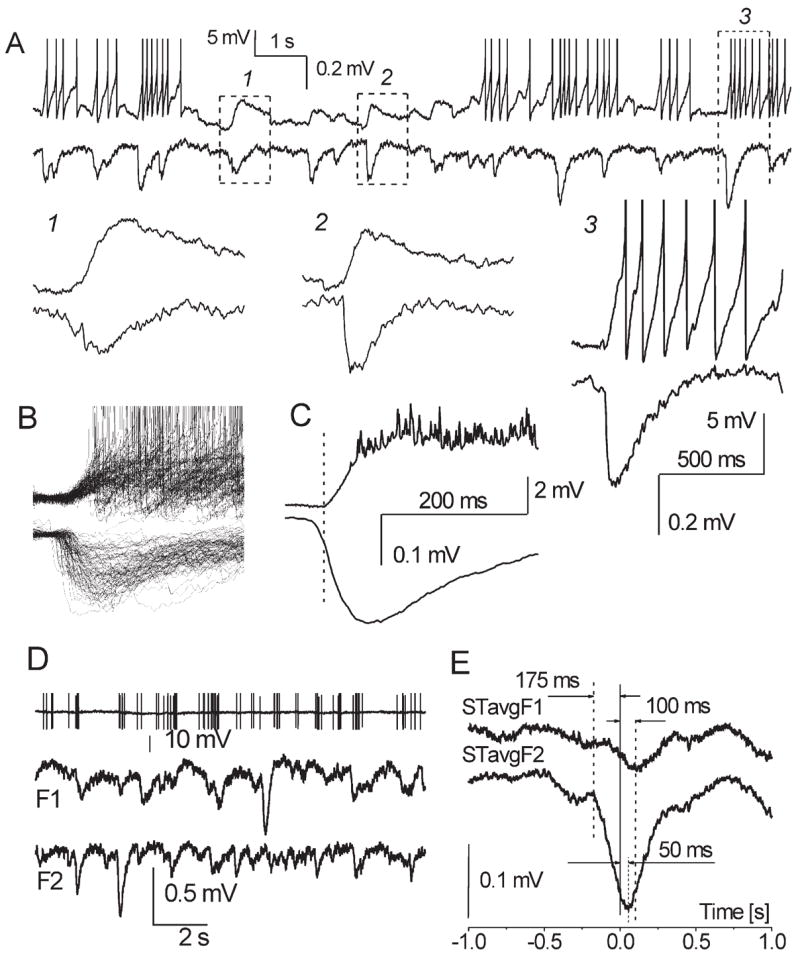
Simultaneous recordings of sLLDs in a mitral cell and sGLFPs from a glomerulus containing the mitral cell tuft. (A) Dual sweep of intracellular (upper trace) and field activity (lower trace). Spikes of mitral cell are truncated. Insets with an expanded time scale demonstrate variability of sGLFP locked to sLLD and different kinetics of sGLFP as compared with sLLD. (B) Overlapping sweeps with sLLD/sGLFP pairs (n = 80). All sLLD onsets are set at the same time point (t = 0). Note 10-fold difference between smallest and biggest sGLFP indicating different amount of cells involved in successive sGLFP in a given glomerulus. (C) Averaged sLLD and sGLFP (n = 80) with the reference point set at the sLLD onset show 9.8 ms delay of sLLD upon initiation of sGLFP. (D) Spontaneous firing of another mitral cell (high-passed at 1 kHz, spikes are truncated) and simultaneous field potential recordings from adjacent glomeruli (F1 and F2, distance 100 μm). (E) Spike-triggered averaged waveform (STavg, n = 50) obtained from this triple recording. Spikes of mitral cell that were preceded by 1 s silence period were put at t = 0 and concomitant waves at F1 and F2 sites were averaged. Note that in mitral cell first spike of a cluster occurs 175 ms after sGLFP initiation in F2 when STavgF2 reached 87% of its maximum; cross-correlation of mitral cell spike clusters with sGLFP in F1 is weaker, and STavgF1 is delayed for 100 ms relative to STavgF2.