
Fig. 11.
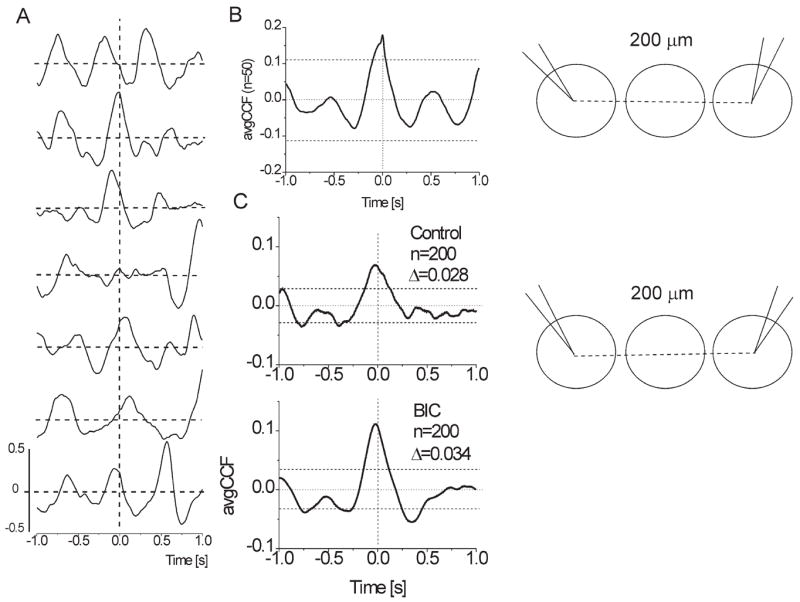
Cross-correlation of sGLFPs. (A) Examples of CCF calculated over 4 s sweeps in a row of total 50 sweeps show high variability of waveforms and transient character of cross-correlation; recording sites were separated by one glomerulus in a conventional horizontal slice. (B) Averaged CCF (n = 50 sweeps of 4 s) has a significant central peak shifted 20 ms to the left indicating functional interconnection between two glomeruli in control conditions. (C) Averaged CCFs (n = 200 sweeps of 4 s in each) for a dual recording in an isolated GL stripe from two adjacent glomeruli (interelectrode distance 100 μm) showed ~60% increase of cross-correlation upon application of 20 μM BIC. Note that both in control and in BIC the central peak of avgCCFs is shifted to the left for 25–30 ms indicating leadership of the second (i.e. not reference) glomerulus. Horizontal dashed lines designate 95% confidence levels. Insets on the right illustrate location of the recording sites.