
Fig. 12.
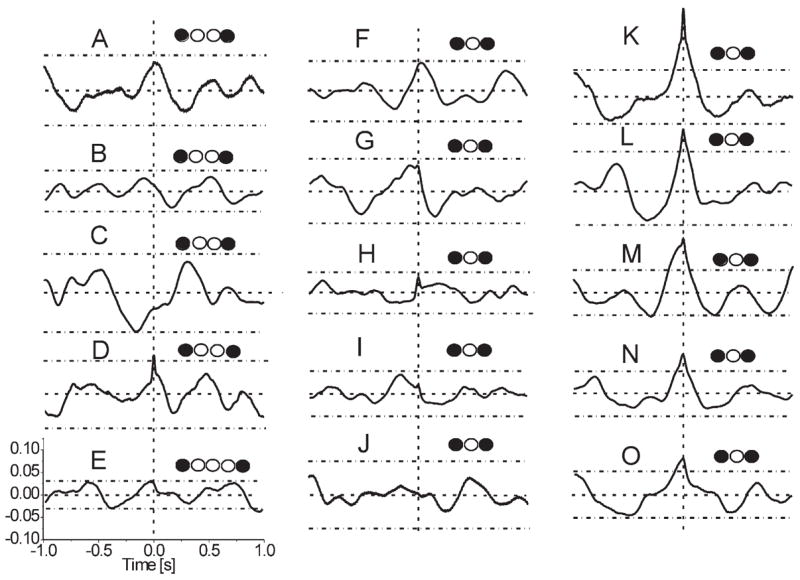
Cross-correlation of spontaneous field potentials recorded in pairs of remote glomeruli. Averaged CCFs in the left and middle columns indicate the absence of significant cross-correlation. In the right column avgCCFs show significant cross-correlation around zero time lag. Horizontal dashed lines in each plot designate confidence levels ( ± Δ, P < 0.01) above and below the zero level (CCF = 0). Vertical dashed lines indicate zero time lag (τ = 0). Hollow circles designate glomeruli separating recording sites (filled circles). Sharp peaks at τ = 0 overriding slow waves in some avgCCFs (D, H, I, K, M) may indicate a spontaneous synchronous common synaptic input (ex. from the ON).