
Fig. 2.
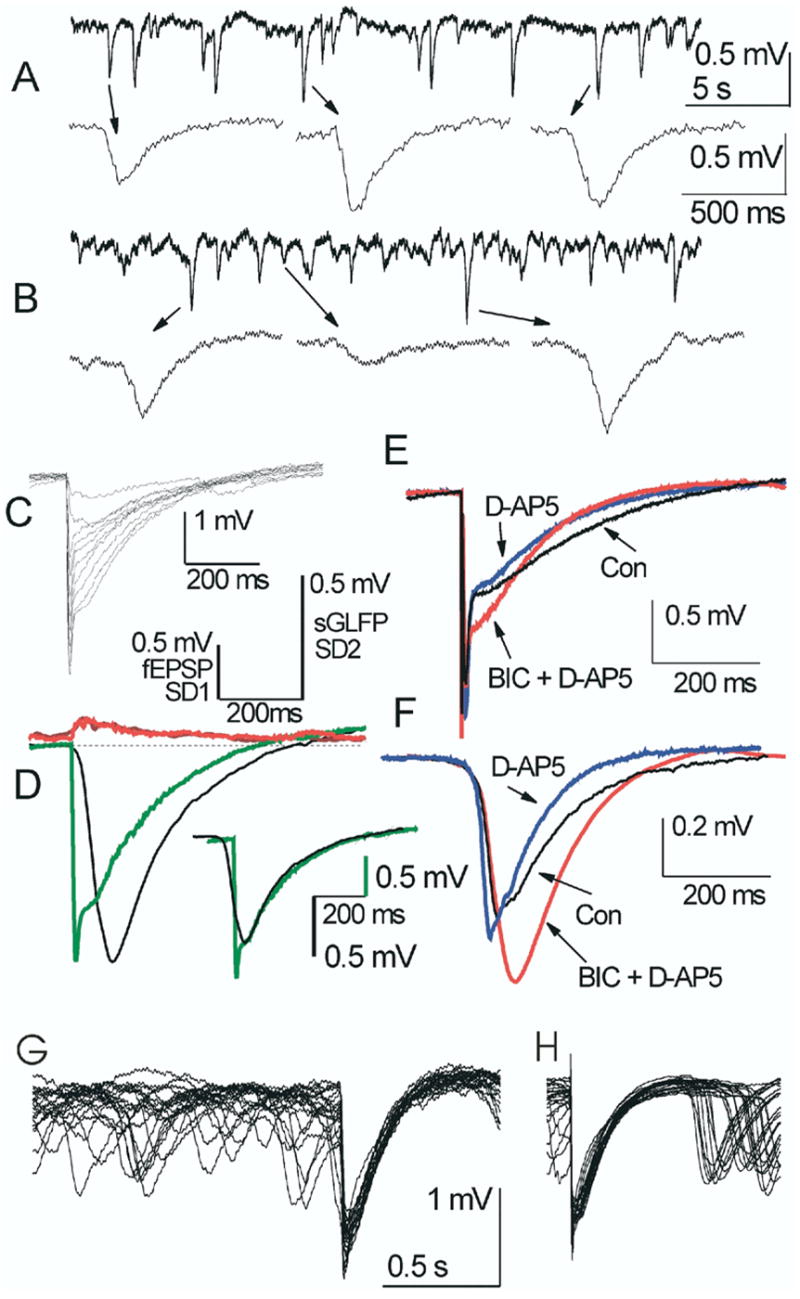
Spontaneous glomerular field potentials in two different control slices (A and B). Insets show some individual sGLFPs. Note various amplitudes and time courses of spontaneous events. (C) eFPs in the GL are comparable in their time course and amplitudes with sGLFPs. Incremental rise of stimulus intensity from 10 to 100 μA (Δ = 10 μA) was followed by rise in the eFP amplitude and gradual development of a fast initial phase. (D) Averaged eFP in this site (n = 10, stimulation at 30 μA, green line) and an average of 10 sGLFPs exceeding 90% of the largest sGLFP (n = 10, black line) display identical duration and identical distributions of standard deviations (SD1 (red) for eFP and SD2 (brown) for sGLFP). Scales above are given for averaged eFP with its standard deviation SD1 (left scale) and for averaged sGLFP with its standard deviation SD2 (right scale). Adjustment of the averaged sGLFP peak and maximum of a slow eFP to the same point reveals an identical decay time course and different rise time (D, inset). Note difference in amplitude scaling for sGLFP and eFP. (E) Averaged eFP (n = 10) with stimulation at 100 μA in another slice and (F) averaged sGLFP from the same recording site (n = 10, > 90% of the maximal amplitude) display similarity in changes upon application of synaptic blockers. NMDA-receptor blocker D-AP5 shortened decay time and GABAA-receptor blocker BIC increased amplitudes in both sGLFP and eFP (slow phase) to a similar extent. (G, H) Overlapping eFP along with fragments of spontaneous field activity in two different slices treated with BIC. Note occlusion of sGLFP by eFP and similar decay kinetics in eFP and the highest sGLFPs.