
Fig. 4.
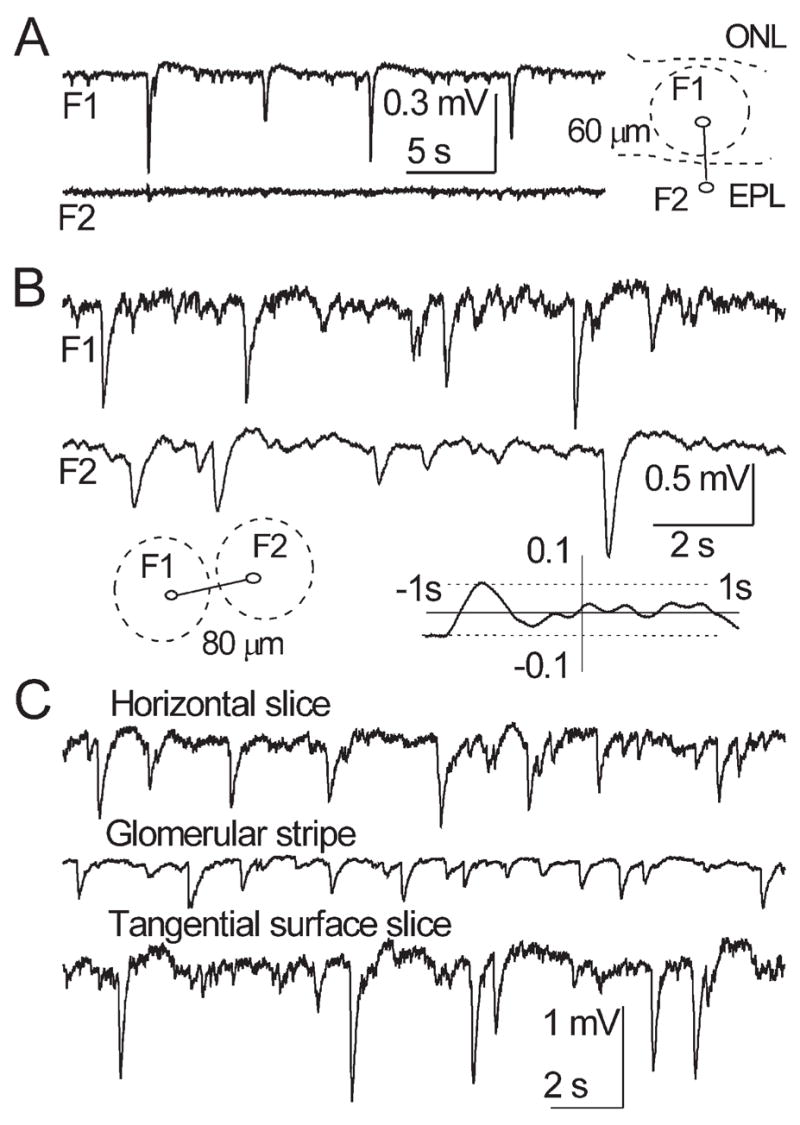
(A) Simultaneous recordings from a glomerulus in GL (F1) and a site in EPL below (F2). Sites F1 and F2 are 60 μm apart, dashed lines designate boundaries of layers and the glomerulus. Note total absence of a field spread or reversal in F2. (B) Simultaneous recordings from two adjacent glomeruli in a tangential slice. Sites F1 and F2 are 80 μm apart, dashed lines designate glomeruli (inset on the left). Note that even the largest sGLFPs in one site do not induce noticeable fluctuations in the other site. Lack of significant peaks in CCF (inset on the right) confirms independence of sGLFP occurrence in the two sites shown above. In this CCF the abscissa shows the average level (solid line, CCF = 0) and designates time lags from −1 s to +1 s; vertical solid line (the ordinate) is from −0.1 to +0.1; horizontal dashed lines above and below the abscissa designate ± 95% confidence interval. (C) Traces of sGLFP in a control horizontal slice (upper trace), in a stripe of isolated GL (middle trace), and in a tangential slice (lower trace). Somewhat lower sGLFP amplitudes in the glomerular strip are probably due to trauma while dissecting a 200 μm stripe from a horizontal 400 μm thick slice. sGLFPs in tangential slices sometimes could exceed those in control slices.