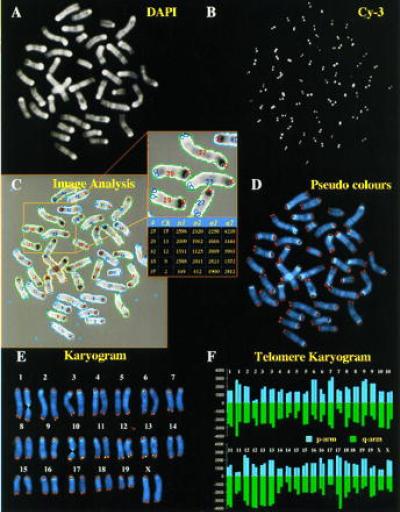
Figure 1.

Quantitative FISH analysis of individual telomeres illustrated on a bone marrow-derived metaphase spread from a BALB/c mouse. (A) Digital image of DAPI-stained chromosomes. (B) Individual telomeres in the Cy-3 fluorescence image. (C) Output of dedicated image analysis software which combines the DAPI and Cy-3 images, identifies chromosomes and telomeres, assigns colors to the four telomeres (purple, red, light and dark blue), calculates the integrated fluorescence intensity for each telomere after correction for background and expresses the integrated fluorescence intensity of individual telomeres of each chromosome in a table. (D) Combination of DAPI and Cy-3 images after assigning pseudocolors—i.e., blue for DAPI and orange for Cy-3, with the use of Adobe photoshop (Adobe Systems, Mountain View, CA). (E) Individual chromosomes after karyotyping according to standard DAPI banding patterns (19). (F) Finally, the integrated fluorescence intensity is expressed for both p- and q-arm telomeres from each karyotyped chromosome.
