Fig. 2.

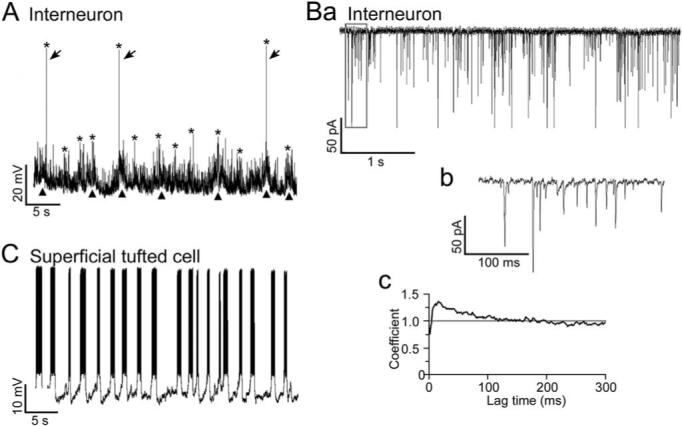
Spontaneous synaptic activity of EPL interneurons and spiking activity of tufted cells. (A) Current clamp recording from the interneuron shown in Fig. 1A. Note the high-frequency of spontaneous EPSPs and occasional action potentials (arrows). Asterisks indicate peaks of sporadic increases in the EPSP/action potential frequency (maximum for this cell, 188±18, n=5). Note the fluctuations in membrane potential (triangles) often associated with the increases in EPSP frequency. The resting membrane potential was −75 mV. (Ba) Voltage clamp recording from another interneuron near the resting membrane potential (−80 mV). The mean EPSP frequency of the interneuron was 42 Hz, which was relatively low. (Bb) Expanded view of the boxed area in Fig. 2Ba. (Bc) Autocorrelation coefficient for the EPSC trains of the same interneuron. Interneurons with relatively low EPSC frequencies exhibited significant autocorrelation near zero time lag (confidence limit >99.97%; C=1 indicates chance occurrence), indicating that the EPSCs had a tendency to occur in bursts. (C) Current clamp recording from the superficial tufted cell shown in Fig. 1F. Action potentials with a mean frequency of 42±6 Hz occurred in bursts at a rate of 0.52±0.06 Hz (n=5). The resting membrane potential, measured during inter-burst intervals, was −56 mV.
