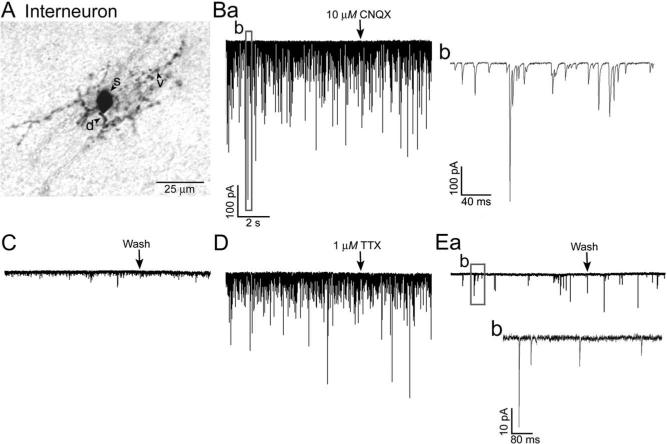
Fig. 3.
Effects of CNQX and TTX on EPSCs in EPL interneurons. (A) Photomicrograph of an EPL interneuron from a C57BL/6J mouse. (Ba) Voltage-clamp recording from the same cell showing spontaneous EPSCs before CNQX superfusion and at the beginning of the CNQX superfusion (10 μM, at the arrow). Note the wide range of EPSC amplitudes. The boxed area is expanded in Fig. 3Bb. (C) After 8.7 min in CNQX, few EPSCs remained, and the slice was superfused with normal ACSF (Wash, at the arrow). (D) After 45 min in normal ACSF, spontaneous EPSC activity had largely recovered, and the slice was then superfused with TTX (1 μM, at the arrow). (Ea) The EPSC frequency was greatly reduced after 33.4 min in TTX, and relatively few EPSCs were observed; those in the boxed area are enlarged in Fig. 3Eb. Scales for Fig. 3C, D, and Ea as in Fig. 3Ba.

