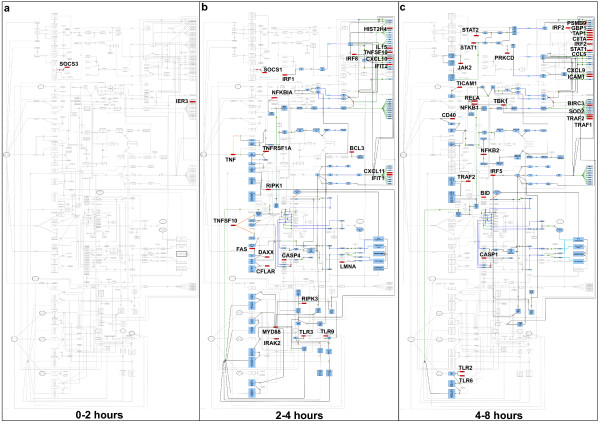
Figure 7.
The integrated pathway diagram presented at (a) 1–2 hours, (b) 2–4 hours and (c) 4–8 hours post-Ifng treatment. Differentially expressed genes are highlighted in red and the possible consequential downstream events resulting from the changes, (assuming de novo protein synthesis) are highlighted in blue.

