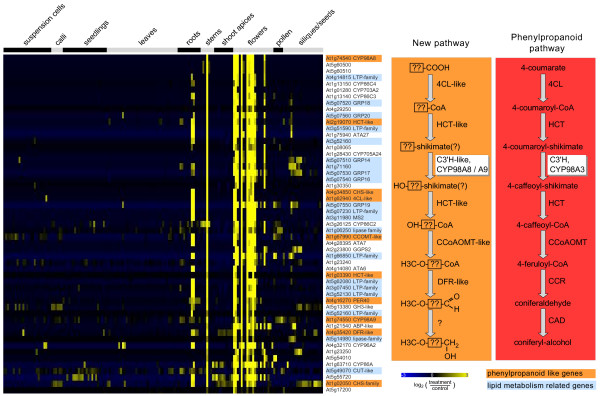
Figure 5.
Expression analysis using CYP98A8 as bait. Data from published Affymetrix microarrays representing 167 organ and tissue samples were retrieved from the Genevestigator database [10]. Background correction and ratio log2-ratio generation was performed as describe in Methods. The expression vector of CYP98A8 was compared to those of 4,119 genes annotated in diverse databases to be involved in any metabolic pathway using the 'ExpresionAngler' algorithm [9]. Expression profiles of co-expressed genes with a correlation coefficient of more than 0.6 are shown as a heatmap. Groups of samples are indicated on top of the heatmap. Mean-centered signal intensity ratios are color coded as indicated on the bottom of the heatmap. Genes with similarity to enzymes of the phenylpropanoid pathway are highlighted in orange. Genes related to lipid metabolism are highlighted in blue. Detailed information on the co-expressed genes and samples can be found in Additional File 5. To the right a section of the phenylpropanoid pathway is outlined in red and the putative duplicated pathway as hypothesized based on the co-expression analysis of CYP98A8 is outlined in orange.

