Abstract
Polarization of low-lying excitonic bands in finite-size semiconducting single-walled carbon nanotubes (SWNTs) is studied by using quantum-chemical methodologies. Our calculations elucidate properties of cross-polarized excitons, which lead to the transverse optical absorption of nanotubes and presumably couple to intermediate-frequency modes recently observed in resonance Raman excitation spectroscopy. We identify up to 12 distinct excitonic transitions below the second fundamental band associated with the E22 van Hove singularity. Calculations for several chiral SWNTs distinguish the optically active “bright” excitonic band polarized parallel to the tube axis and several optically “weak” cross-polarized excitons. The rest are optically (near) forbidden “dark” transitions. An analysis of the transition density matrices related to excitonic bands provides detailed information about delocalization of excitonic wavefunction along the tube. Utilization of the natural helical coordinate system accounting for the tube chirality allows one to disentangle longitudinal and circumferential components. The distribution of the transition density matrix along a tube axis is similar for all excitons. However, four parallel-polarized excitons associated with the E11 transition are more localized along the circumference of a tube, compared with others related to the E12 and E21 cross-polarized transitions. Calculated splitting between optically active parallel- and cross-polarized transitions increases with tube diameter, which compares well with experimental spectroscopic data.
Keywords: helical nanotube coordinates, transverse absorption, exciton localization, collective electronic oscillator method
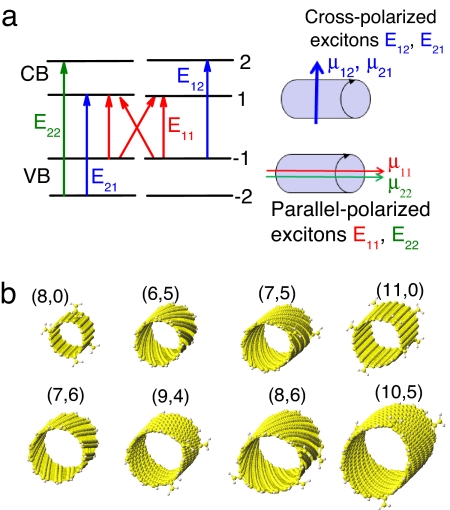
Electronic structure of nanomaterials and its changes upon photoexcitation affect many important characteristics of nanoscale optoelectronic devices, including carrier transport and luminescence efficiency. Therefore, a better understanding of electronic and optical properties of nanosystems reveals fundamental physical phenomena and has important technological implications. Carbon nanotubes are one of the most auspicious examples of quasi-one-dimensional (1D) nanoscale materials, promising fascinating applications ranging from nanoelectronics (1–5) to medical technologies (6). Experimentally, the electronic structure of semiconductor single-walled carbon nanotubes (SWNTs) is mainly probed by means of absorption, fluorescence, and Raman spectroscopies (7–11). Early optical spectra in SWNTs have been interpreted in terms of free electron-hole carriers. These single-particle states are grouped into equally spaced sub-bands of valence and conduction bands with diverging density of states at band-edges known as van Hove singularities (12), labeled by ±1, ±2, …, etc., with increasing energies. The transitions arising among these manifolds are typically labeled as Eij, where indices i and j refer to the valence and conduction band singularities, respectively, as schematically presented in Fig. 1a.
Fig. 1.
Illustration of optical transitions and tube structures studied here. (a) Schematics of optical transitions in SWNTs corresponding to collinear, parallel-polarized (red and green color) and perpendicular, cross-polarized (blue color) excitations as illustrated by directions of the respective transition dipole moments μij. (b) Molecular structures of carbon nanotubes considered in this study. Optimal geometries are presented in the perspective depth view for visual comparison of tube diameters and chiralities, labeled according to the tube index (n and m). All tubes are finite and chosen to have approximately the same length of ≈9–12 nm. Dangling bonds are terminated with hydrogen atoms.
Recent studies established, however, that the quasi-1D structure of the material and a small dielectric constant lead to high electron-hole binding energies and the formation of strongly bound excitons (composite electron-hole pairs) as the primary photoexcited species. Theoretical studies (13–15), followed by spectroscopic experiments (16–18), have unambiguously revealed that the photophysics of SWNTs is dominated by excitons with typical binding energies of 0.2–0.5 eV (19–25), depending on the tube diameter and chirality. Electronic correlation effects give rise to several excitonic bands associated with each transition between van Hove peaks. Each resulting manifold contains both optically allowed (bright) and optically inactive (dark) exciton states, as well as a continuum band (26, 27). For example, splitting of the nearly doubly degenerate HOMO–LUMO transitions E11 into four distinct excitonic transitions (15) is schematically shown by red lines in Fig. 1a. This introduces a complex structure of overlapping interband states with different angular momenta (28), complicating dramatically the electronic structure of SWNTs and affecting their photophysical properties. For example, the energy position of the dark excitons with respect to the bright ones impacts the nanotube luminescence. Recent theoretical (15, 29) and experimental (30) studies explain the typical low photoluminescence quantum yield in SWNTs by the existence of dark excitons below the first optically bright exciton state that trap much of the exciton population. The existing experiments have focused mostly on the optically allowed fundamental excitonic transitions (E11, E22, and so on), while the information on the entire excitonic spectra of SWNTs remains incomplete.
The dependence of optical response on the polarization direction of the incident light with respect to the tube axis can be used to extend investigations to other excitonic bands in SWNTs. For example, for light polarized parallel to the tube axis, only Eii excitations are allowed. The corresponding strong Eii peaks have been clearly observed in optical spectra and investigated intensively during the past few years. In contrast, the selection rules for perpendicular polarization (cross-polarization) of light (31) allow optical absorption between sub-bands, where quasi-angular momenta differ by one, such as E12 and E21. There are, however, very limited studies of such transitions. Within one-electron theory, transverse optical absorption occurs at an energy that is exactly in the middle of the two lowest longitudinal absorption energies (32). Phenomenological implementation of electron-hole interaction and depolarization effects on the effective mass Hamiltonian shifts E12 and E21 energies to the blue; the shift amplifies with increase of Coulomb coupling matrix elements (28). Theoretically, it is predicted that the intensity of cross-polarized peaks is reduced drastically in SWNTs (33). Nonetheless, recent results of photoluminescence anisotropic spectroscopy report resolved absorption peaks for the polarization perpendicular to the SWNT axis (34, 35). Investigations of intermediate-frequency Raman modes (36) in bundled SWNTs also suggest the existence of cross-polarized excitations (37). However, the structure of cross-polarized excitons remains ambiguous and calls for further detailed studies.
In this article, we present a quantum-chemical investigation of the low-energy excitonic bands arising from E11, E12, and E21 transitions in finite-size SWNTs that reveals the nature and localization properties of cross-polarized excitons. This modeling involves a time-dependent Hartree–Fock (TDHF) formalism combined with semiempirical Hamiltonians (38). This technique implemented in the Collective Electronic Oscillator code (39, 40) permits calculations of hundreds of molecular excited states in very large systems (here up to 1,300 atoms in size). Utilization of reliable semiempirical approaches allows for automatic inclusion of curvature-induced effects and the deviation from the sp2 hybridization, important in the case of SWNTs and other organic materials. The TDHF approximation directly addresses essential electronic correlations and excitonic effects. This methodology has been applied to calculate optical properties of a variety of conjugated molecular materials (39, 40). Recently, we used this technique to investigate a number of excited-state phenomena in SWNTs, including anharmonic coherent phonon dynamics (18), quantification of exciton-phonon coupling constants (41), effects of Peierls distortion and exciton self-trapping (23, 24), and characterization of triplet (25) and high-energy excitonic transitions (E33 and E44) (42). Here, we focus on bright, dark, and weakly allowed excited states related to low-lying excitonic bands by disentangling longitudinal and circumferential components of excitations.
Results and Discussion
Eight considered SWNTs of various diameters and nearly the same lengths are shown in Fig. 1b. Unsaturated chemical bonds at the open tube ends have been capped with hydrogen atoms to remove mid-gap states caused by dangling bonds, as described in detail in ref. 24. We carefully checked that our capping does not introduce artifacts into tube geometries and their electronic structure (24). All molecular systems are oriented along the z-direction, have a finite length of 9–12 nm, and comprise several repeat units. The nanotube lengths were chosen to be significantly larger than the diameter of the tube with characteristic exciton sizes [≤ 5 nm (23, 24)]. For these conditions, the finite size of 1D systems is expected to reproduce well the properties in the infinite-size limit (24). Ground state optimal geometries of all tubes in Fig. 1b are obtained by using the Austin Model 1 (AM1) (43). The vertical transition frequencies from the ground state to the singlet excited states, their oscillator strengths, and transition density matrices were then computed with the CEO procedure based on the ZINDO Hamiltonian, as described in supporting information (SI) Text and elsewhere (e.g., refs. 38–40). We calculate up to 70 lowest singlet excited states for each considered SWNT shown in Fig. 1b. Because of the finite size of the considered tubes, calculated excited states are discrete, in contrast to the band structure obtained from infinite tube calculations (14, 21, 22).
The second lowest excited state is usually strongly optically allowed. It collects nearly all of the oscillator strength from its parent E11 band and has a large transition dipole moment directed along the tube axis. Our calculations always predict the lowest state to be a dark exciton, which agrees with other theoretical and experimental studies (44). The next fundamental optical excitation E22 is separated from E11 by an energy of ≈1 eV in all SWNTs we consider and formally belongs to the second excitonic band. We refer to parallel-polarized E11 and E22 transitions as the z-polarized excitons, because the tube axis is oriented along the z-direction for all considered SWNTs. Between the E11 and E22 transitions, there are many optically forbidden dark states and a few weakly allowed excitons, all representing delocalized transitions. Each excitonic band is a manifold of closely spaced levels. Within our theoretical framework, the changes induced in the density matrix by an external field reflect the changes in the electronic density matrix induced by an optical transition from the ground state to an excited state. The size and localization of an exciton center of mass with respect to the molecule alignment can be extracted from a 2D real-space analysis of this quantity, as outlined in SI Text and elsewhere (e.g., in ref. 38). We use this approach to sort discrete states into excitonic bands by examining the nodal structure along diagonals of the matrices. Delocalized excited states can be considered as standing waves in quasi-1D structures, and the nodes are related to the quasi-particle (exciton) momenta (39). Consequently, the zero-node state is associated with the k = 0 momentum exciton in the infinite chain limit, which may be optically allowed. Here, we focus only on zero-node states in SWNTs. States having one or more nodes are not considered because they belong to the same band as the respective zero-node exciton. Below the bright E22 exciton, there are typically 9–11 states, including the bright E11 state, whose transition densities do not have nodes.
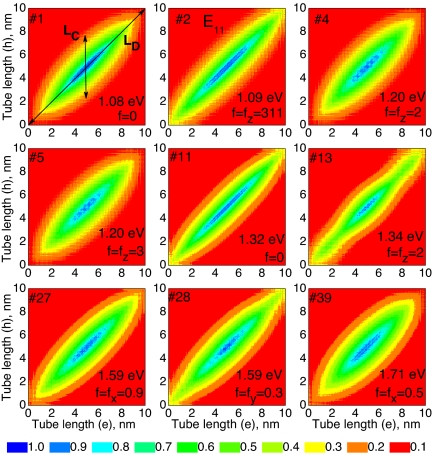
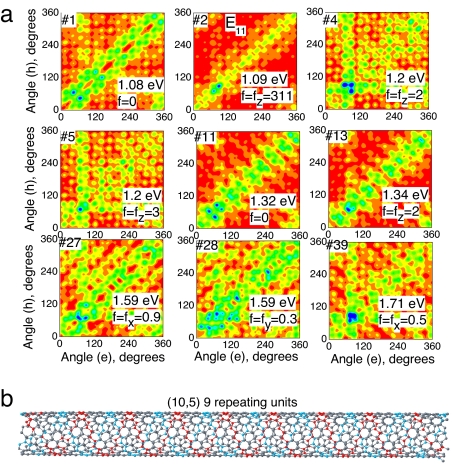
Fig. 2 presents the contour plots of the transition density matrix corresponding to the zero-node states from the first excitonic manifold of the (10,5) SWNT. Other SWNTs we have studied exhibit similar trends and are not shown. Each transition density matrix is labeled by a number according to the energy of the photoexcited state with respect to the ground state. For comparison, the excitation energies and the dominant x-, y-, or z-component of the oscillator strength (f) are also shown on each plot. In all color panels, the axes correspond to carbon atoms, whose coordinates are labeled along the tube axis. Consequently, these plots mostly show the distribution of the excitonic wavefunction along the tube. Thus, the nine displayed first excitons of the (10,5) tube are all delocalized transitions with respect to the tube length and, mainly, have weak or zero oscillator strength, except the second (bright) E11 state.
Fig. 2.
Excitonic transition density matrices of the (10,5) tube plotted in Cartesian coordinates. The first nine zero-node excitonic states are presented by two-dimensional contour plots as a function of the electron (vertical axis, nanometers) and hole (horizontal axis, nanometers) coordinates along the tube axis. The color code is presented at the bottom. Excitons are labeled according to their order number with respect to the ground state. The transition energy and the dominant oscillator strength component (f) are shown for each excitonic state. The strongly allowed optically active (bright) exciton is marked by E11. These plots reflect the distribution of the excitonic wavefunctions along the tube axis.
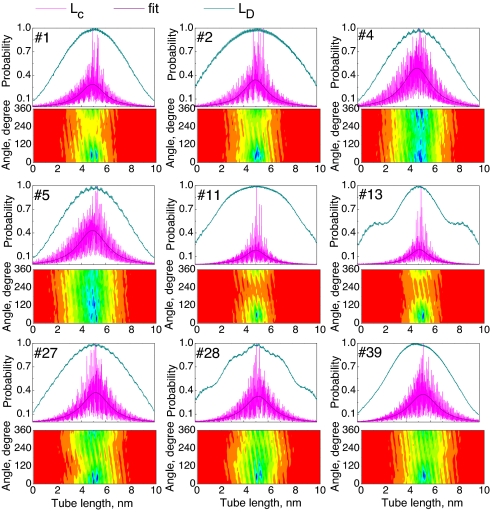
The respective slices along the matrix diagonal (LD direction) for all nine excitons are presented in Fig. 3. These characterize the distribution of an excitonic wavefunction along the length of the tube. Both matrix contour plots and diagonal LD slices (Figs. 2 and 3) demonstrate that the center of mass of all nine first-band excitons is spread over the entire (10,5) tube, which is typical for all studied SWNTs. The amplitudes vanish at the tube edges, which reflects excitonic scattering (reflection) at the ends (39). Such exciton delocalization patterns are identical to those observed in other quasi-1D materials (23, 24, 38, 40). Another important characteristic of the electronic excitation is the exciton coherence size LC (maximal distance between electron and hole along the tube axis). The LC cross-sections of the transition densities are shown in Fig. 2 and represent the probability distribution of an electron coordinate, when the position of a hole is fixed in the middle of a tube. Such a representation typically reflects the delocalization and binding strength between electron and hole in SWNTs (14, 24, 42). Plots in Figs. 2 and 3 show that LC is finite for all nine excitons. These correspond to tightly bound singlet excitons, with an excitonic size of 3.5–5 nm, depending on the state.
Fig. 3.
Delocalization properties of nine zero-node excitonic states of the (10,5) tube, characterizing excitonic wavefunction distribution along the tube axis (upper panels) and the tube circumference (lower panels). The diagonal slice (LD) of the transition density matrix represents the electron-hole pair center-of-mass position along the tube. Off-diagonal slices (LC) indicate the electron coordinate along the tube, when the hole is fixed in the middle, thus determining the maximal distance between an electron and a hole along the tube. This distribution is fitted by a Lorentzian function. The contour plots (lower panels) represent the probability of finding the electron on the tube circumference when the hole is fixed in the middle of the tube. This probability is a function of position of the electron along the tube axis (x-axis, nanometers) and the electron position along the tube circumference (y-axis, degrees), measured as an angle 0 < φi < 2π. The color scheme is given in Fig. 2.
According to recent studies (15, 29), four parallel-polarized excitons are expected to form from the E11 transition of SWNTs due to nearly doubly degenerate HOMO–LUMO transitions, three of which are dark. Our subsequent analysis will identify them as states 1, 2, 11, and 13 for the (10,5) tube in Figs. 2 and 3. By analogy, because of molecular orbital degeneracy, we expect to find eight distinct cross-polarized excitonic bands related to E12 and E21 transitions (see Fig. 1a), most of which are also dark. Coulomb correlation effects are expected to lift the degeneracy from these states. Indeed, we are able to identify up to four to six such states depending on the nanotube considered. For example, Figs. 2 and 3 show five such states (4, 5, 27, 28, and 39). Higher-energy cross-polarized states are hard to distinguish because of enhanced density of states and overlap with E22 excitonic bands. All of these states have either a vanishing or a very weak oscillator strength. Note that, because of state mixing and open boundary conditions, some cross-polarized excitons might have a small amount of z-polarized transition dipole moment. Such state interference complicates the analysis of excitonic structure and the separation of z-polarized excitons from cross-polarized ones. Our calculations show that each considered tube has at least two states with nearly degenerate energies and dominating oscillator strength components directed along x and y (for example, states 27 and 28 in Figs. 2 and 3). Those states are weakly allowed cross-polarized excitations, for which degeneracy is attributed to the cylindrical symmetry of the SWNTs. We emphasize that all parallel-polarized (E11) and cross-polarized (E12 and E21) states have very similar distributions of the excitonic wavefunctions along the tube axis and separations between the electron and hole (see Figs. 2 and 3); however, their angular momenta may differ substantially (28).
To characterize cross-polarized excitations, the distribution of the excitonic wavefunction along the tube circumference needs to be analyzed. In principle, transition density matrices contain both axial and azimuthal distribution. However, these properties cannot be visualized from the 2D color maps in Fig. 2, which reflect rather an averaged distributions. The information regarding wavefunction delocalization with respect to the tube circumference can be extracted by fixing the position of one of the charges (either electron or hole) on the tube, while presenting the transition density matrix as a 2D function of electron position along the tube length and along the radial angular coordinate φi. The resulting contour plots of the transition density matrix for the first nine zero-node excitons in the (10,5) tube are displayed in Fig. 3 (lower panel in each state). All nine excitons demonstrate a delocalized character along the tube circumference φ, in agreement with other theoretical findings (20). However, states marked as 1, 2, 11, and 13 show a narrower distribution of the electron's density with respect to the radial angle, which, in addition to their smaller excitonic sizes, distinguishes these four excitons from the other states. These four excitons belong to the parallel-polarized parent E11 transitions, as evidenced by their oscillator strengths (e.g., the z-polarized bright exciton is among these four states).
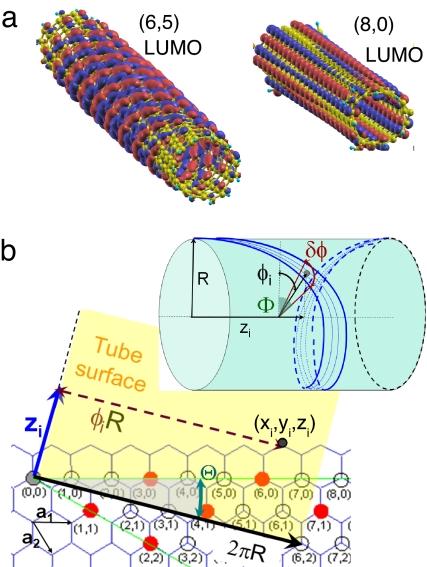
A more accurate determination of cross- and parallel-polarized states can be obtained by using the natural helical coordinate system. The lowest unoccupied molecular orbitals (LUMOs) plotted for chiral (6,5) and zigzag (8,0) SWNTs in Fig. 4a emphasize a well defined relationship between the orbital density distribution along the tube surface and the natural symmetry of a chiral tube. As can be seen in Fig. 4a, the orbitals follow the chiral angle Θ between the tube axis and the chirality vector C⃗h = na⃗1 + ma⃗2 (see Fig. 4b) and determined as
 |
Here, a⃗1,2 are lattice vectors of a graphene sheet (12). An ith carbon atom on a surface of the tube can be defined by its cylindrical coordinates: position along the tube axis zi, and an azimuthal angle φi, as shown in Fig. 4b. To this end, we define a subset of carbon atoms with coordinates zi and φi that satisfies the conditions
where an arbitrarily small width parameter δΦ is roughly chosen as the angular distance between the two nearest carbons. Thus, for a given tube index (n, m) we can investigate the excitonic delocalization among atoms selected by Eq. 1. For example, Fig. 5b shows these atoms colored red for the (10,5) tube. Cyan carbon atoms represent the replica of the red line shifted by 180°. The cyan and red lines wrap around a tube from opposite sides. Comparison of transition density distributions between the red and cyan directions allows one to visualize how an exciton is mutually delocalized over both opposite tube sides.
Fig. 4.
Dependence of molecular orbitals on the geometrical parameters of nanotubes. (a) The lowest unoccupied molecular orbitals (LUMOs) of chiral (6,5) and zigzag (8,0) carbon nanotubes. The positive and the negative lobes of the wavefunction are shown in the red and blue, respectively. The orbital density distribution strongly follows the tube helicity. (b) Schematic presentation of the nanotube geometrical parameters. Vectors a1 and a2 are the unit vectors of the hexagonal graphene lattice. The chirality vector Ch = na1 + ma2 (black arrow), chiral angle Θ, and translational vector Zi directed along the tube length (blue arrow) of a (6,2) tube are shown as an example. (Inset) Natural helical coordinates of a chiral tube. All points on the surface area between the two blue lines satisfy Eq. 1.
Fig. 5.
Representation of the transition density matrices in the helical tube coordinates. (a) Contour plots of the transition density matrices corresponding to nine excitons of the (10,5) tube shown in Figs. 2 and 3 in the helical coordinate system schematically shown at bottom and described by Eq. 1. Positions of the electron and hole are labeled with an azimuthal angle 0 < φi < 2π. The helical lines of the (10,5) tube are highlighted in red and cyan (orthogonal to the red line) on the tube surface. (b) Four excitons numbered 1, 2 (bright state), 11, and 13 show much stronger localization with respect to the tube circumference, compared with other states. These four excitons are attributed to parallel-polarized E11 transitions, whereas the others are cross-polarized E12 and E21 excitons. The color scheme is given in Fig. 2.
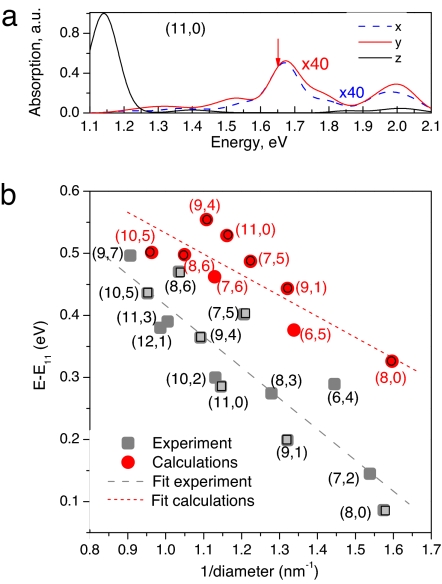
Fig. 5a shows the distribution of transition density matrix values along the red line for nine zero-node states for the (10,5) tube. To eliminate the artifacts of tube ends, we focus only on one central unit-cell of a tube. A similar picture is valid for the cyan direction (data not shown) reflecting the delocalized character of the excitonic wavefunction with respect to the tube circumference. By analogy with LC, the coherence azimuthal size of an exciton can be defined as the largest off-diagonal extent (LCA) of the nonzero matrix area, presented in Fig. 5. It is clearly seen that LCA is finite only for the four z-polarized excitons, whereas it is spread over the entire matrix for other states. The finite LCA size indicates that z-polarized excitons originating from the E11 transition are more localized along the tube circumference as compared with the cross-polarized excitations arising from E12 and E21 transitions. Remarkably, transition density matrices analyzed in the helical coordinate systems have very similar patterns for the (10,5) and other studied SWNTs [e.g., Fig. S1 shows plots calculated for the (7,6) tube]. This representation clearly distinguishes z-polarized states from cross-polarized ones. Among the four z-polarized excitons, one is optically active, two are completely dark, and one is weakly allowed with a dominant z-component in its oscillator strength. The other excitons are cross-polarized E12 and E21 states. The oscillator strength of these cross-polarized excitons is mostly suppressed. However, there are at least two semibright, nearly isoenergetic states with nonzero x- or y-components in their oscillator strength, which can be probed experimentally. Fig. 6a shows theoretical polarized absorption spectra of the (11,0) tube calculated by using oscillator strengths and empirical 0.1 eV Gaussian linewidth (24). The semidark cross-polarized excitons (such as 27 or 28 in Fig. 5) contribute to the main peak of x- and y-polarized absorption and marked by a red arrow in Fig. 6a. Notably, change in tube length only negligibly affects the position of this peak, while E11 states become slightly red-shifted.
Fig. 6.
Calculated polarized absorption spectra of the (11,0) tube (a) and variation of excitation energy of semibright cross-polarized excitons with respect to the excitation energy of the first bright exciton with parallel polarization, as a function of the inverse tube diameter (b). The gray and red dashed lines show the fit of experimental and theoretical data using Eq. 2.
Fig. 6b compares the experimentally measured (via Raman spectroscopy) (37) and calculated energy splittings between the first bright E11 and a semibright cross-polarized E12 (E21) excitations as a function of the tube diameter. Both experimental and calculated results demonstrate an increase in the splitting as tube diameter increases. This trend can be approximately linearly fit as
where S is the slope and d is the tube diameter. Numerical fitting gives ΔE0exp = 0.91 eV, ΔE0th = 0.87 eV, Sexp = 0.50 eV·nm, and Sth = 0.33 eV·nm (in atomic units, Sexp = 0.35 and Sth = 0.23). Such scaling can be interpreted as a consequence of observed different excitonic delocalizations for the parallel- and cross-polarized E12 excitations in the circumferential dimension. z-polarized states are more localized, and their transition energies are strongly stabilized as the tube curvature is reduced. In contrast, cross-polarized states are completely delocalized in the azimuthal dimension, and their transition energies are less sensitive to the tube diameter. Therefore, the splitting displayed in Fig. 6 increases with tube diameter. Finally, we notice that the optical transition dipole moment of cross-polarized excitations is expected to be sensitive to perturbations that break the tube symmetry in the circumferential dimension, such as inhomogeneous electric fields, and varying local dielectric constants appearing due to tube bundling and defects. Such perturbations affect properties of cross-polarized excitations because of their complete delocalization in the radial dimension. Indeed, recent experiments report that the optical signatures of cross-polarized excitations are more pronounced in bundles as compared with individual tubes (45).
Conclusions
We have investigated computationally and analyzed in detail the properties of all fundamental excitonic bands arising from E11, E12, and E21 single-particle transitions in eight species of SWNTs. Our semiempirical approaches combined with the TDHF approximation capture important excitonic effects dominating SWNT photoinduced dynamics and naturally account for effects of molecular structure, such as the tube chirality and curvature. The results of our simulations show intricate details of excited-state properties in carbon nanotubes focusing on the electronic states corresponding to the cross-polarized transitions responsible for transverse optical absorption in nanotubes. The intermediate frequency vibrational modes, recently observed by resonance Raman excitation spectroscopy experiments, are believed to couple to these excitons. However, the detailed mechanisms of vibrational coupling and the origins of the intermediate frequency vibrational modes are currently not well understood (37).
Because of degeneracy of the corresponding molecular orbitals, each considered transition between the van Hove singularities gives rise to four distinct excitonic bands. Excitations originating from E11 and E12/E21 transitions have transition dipole moments parallel- and cross-polarized to the tube axis, respectively. However, most of these transitions are optically forbidden (dark). We typically observe a single, strongly optically allowed excitation related to the E11 transition and two near degenerate, weakly allowed excitations related to the E12 and E21 transitions. The transition energies of all dark excitons span the entire range from the lowest state to the E22 excitation. All considered excitons represent tightly bound electron-hole quasi-particles, which have very similar delocalization properties along the tube axis. Such properties driven by excitonic effects are dramatically different from predictions of the one electron theory assigning the cross-polarized transition to be exactly in the middle between E11 and E22 transitions (32).
To examine excitonic properties and to classify the resultant transitions, we analyzed the transition density matrices using the natural helical coordinate system. We found that photoexcited charge densities follow the tube helicity. Consequently, such a representation provides a natural universal framework for all SWNTs. Our analysis allows one to recognize critical distinctions between parallel- and cross-polarized transitions. In particular, all z-polarized excitons are more localized in the circumferential dimension as compared with the cross-polarized excitations. This difference is so well pronounced that it allows us to separate the four parallel-polarized E11 excitons from the cross-polarized E12 (E21) transitions. Consequently, the energy splitting between parallel- and cross-polarized excitons increases with increasing tube diameter because the energy of the optically allowed E11 exciton is more sensitive to the tube curvature. On the other hand, we expect the optical signatures of delocalized cross-polarized excitons to be very sensitive to the variation of the dielectric environment around the tube, as well as tube defects. This may allow for a better understanding of self-assembling mechanisms of hybrid materials, such as SWNTs functionalized by DNA strands (46). Although DNA-wrapped SWNTs promise broad applications in metal-semiconductor tube separation and unbundling procedures (47), drug delivery, and cancer therapy (6), very little is known yet about details of SWNT–DNA hybrid formation and its combined properties. Different photophysical behaviors of SWNT excitonic states may be used in future applied spectroscopic measurements as a complementary characterization of specific nanotube samples.
Supplementary Material
Acknowledgments.
We thank Richard Martin, Ado Jorio, and Janina Maultzsch for fruitful discussions. S.K. thanks Prof. Oleg Prezhdo for supporting her visit to Los Alamos National Laboratory during manuscript preparation. This work was supported by Air Force Office of Scientific Research Grant F49620-01-1-0545 and Army Research Office Grant DAAD-19-02-1-0381 (to Z.L. and F.P.). S.K.D. acknowledges support from the Laboratory Directed Research and Development program of Los Alamos National Laboratory. The work at Los Alamos National Laboratory was supported by the Center for Integrated Nanotechnology and the Center for Nonlinear Studies. Los Alamos National Laboratory is operated by Los Alamos National Security for the National Nuclear Security Administration of the U.S. Department of Energy under Contract DE-AC52-06NA25396.
Footnotes
The authors declare no conflict of interest.
This article is a PNAS Direct Submission.
This article contains supporting information online at www.pnas.org/cgi/content/full/0711646105/DCSupplemental.
References
- 1.Mason N, Biercuk MJ, Marcus CM. Local gate control of a carbon nanotube double quantum dot. Science. 2004;303:655–658. doi: 10.1126/science.1093605. [DOI] [PubMed] [Google Scholar]
- 2.Dresselhaus MS. Applied physics: Nanotube antennas. Nature. 2004;432:959–960. doi: 10.1038/432959a. [DOI] [PubMed] [Google Scholar]
- 3.Terabe K, Hasegawa T, Nakayama T, Aono M. Quantized conductance atomic switch. Nature. 2005;433:47–50. doi: 10.1038/nature03190. [DOI] [PubMed] [Google Scholar]
- 4.Chen ZH, et al. An integrated logic circuit assembled on a single carbon nanotube. Science. 2006;311:1735. doi: 10.1126/science.1122797. [DOI] [PubMed] [Google Scholar]
- 5.Avouris P, Chen ZH, Perebeinos V. Carbon-based electronics. Nat Nanotechnol. 2007;2:605–615. doi: 10.1038/nnano.2007.300. [DOI] [PubMed] [Google Scholar]
- 6.Kam NWS, O'Connell M, Wisdom JA, Dai HJ. Carbon nanotubes as multi-functional biological transporters and near-infrared agents for selective cancer cell destruction. Proc Natl Acad Sci USA. 2005;102:11600–11605. doi: 10.1073/pnas.0502680102. [DOI] [PMC free article] [PubMed] [Google Scholar]
- 7.Weisman RB, Bachilo SM. Dependence of optical transition energies on structure for single-walled carbon nanotubes in aqueous suspension: An empirical Kataura plot. Nano Lett. 2003;3:1235–1238. [Google Scholar]
- 8.Bachilo SM, et al. Structure-assigned optical spectra of single-walled carbon nanotubes. Science. 2002;298:2361–2366. doi: 10.1126/science.1078727. [DOI] [PubMed] [Google Scholar]
- 9.Fantini C, et al. Optical transition energies for carbon nanotubes from resonant Raman spectroscopy: Environment and temperature effects. Phys Rev Lett. 2004;93:147406. doi: 10.1103/PhysRevLett.93.147406. [DOI] [PubMed] [Google Scholar]
- 10.Telg H, Maultzsch J, Reich S, Hennrich F, Thomsen C. Chirality distribution and transition energies of carbon nanotubes. Phys Rev Lett. 2004;93:177401. doi: 10.1103/PhysRevLett.93.177401. [DOI] [PubMed] [Google Scholar]
- 11.Doorn SK, Heller DA, Barone PW, Usrey ML, Strano MS. Resonant Raman excitation profiles of individually dispersed single walled carbon nanotubes in solution. Appl Phys A. 2004;78:1147–1155. [Google Scholar]
- 12.Saito R, Dresselhaus G, Dresselhaus MS. Physical Properties of Carbon Nanotubes. London: Imperial College Press; 1998. [Google Scholar]
- 13.Kane CL, Mele EJ. Electron interactions and scaling relations for optical excitations in carbon nanotubes. Phys Rev Lett. 2004;93:197402. doi: 10.1103/PhysRevLett.93.197402. [DOI] [PubMed] [Google Scholar]
- 14.Spataru CD, Ismail-Beigi S, Benedict LX, Louie SG. Excitonic effects and optical spectra of single-walled carbon nanotubes. Phys Rev Lett. 2004;92:774021. doi: 10.1103/PhysRevLett.92.077402. [DOI] [PubMed] [Google Scholar]
- 15.Zhao HB, Mazumdar S. Electron-electron interaction effects on the optical excitations of semiconducting single-walled carbon nanotubes. Phys Rev Lett. 2004;93:157402. doi: 10.1103/PhysRevLett.93.157402. [DOI] [PubMed] [Google Scholar]
- 16.Ma Y-Z, Valkunas L, Dexheimer SL, Bachilo SM, Fleming GR. Femtosecond spectroscopy of optical excitations in single-walled carbon nanotubes: Evidence for exciton-exciton annihilation. Phys Rev Lett. 2005;94:157402. doi: 10.1103/PhysRevLett.94.157402. [DOI] [PubMed] [Google Scholar]
- 17.Korovyanko OJ, Sheng CX, Vardeny ZV, Dalton AB, Baughman RH. Ultrafast spectroscopy of excitons in single-walled carbon nanotubes. Phys Rev Lett. 2004;92:017403. doi: 10.1103/PhysRevLett.92.017403. [DOI] [PubMed] [Google Scholar]
- 18.Gambetta A, et al. Real-time observation of nonlinear coherent phonon dynamics in single-walled carbon nanotubes. Nat Phys. 2006;2:515–520. [Google Scholar]
- 19.Wang F, Dukovic G, Brus LE, Heinz TF. The optical resonances in carbon nanotubes arise from excitons. Science. 2005;308:838–841. doi: 10.1126/science.1110265. [DOI] [PubMed] [Google Scholar]
- 20.Maultzsch J, et al. Exciton binding energies in carbon nanotubes from two-photon photoluminescence. Phys Rev B. 2005;72:241402. [Google Scholar]
- 21.Perebeinos V, Tersoff J, Avouris P. Scaling of excitons in carbon nanotubes. Phys Rev Lett. 2004;92:257402. doi: 10.1103/PhysRevLett.92.257402. [DOI] [PubMed] [Google Scholar]
- 22.Chang E, Bussi G, Ruini A, Molinari E. Excitons in carbon nanotubes: An ab initio symmetry-based approach. Phys Rev Lett. 2004;92:196401. doi: 10.1103/PhysRevLett.92.196401. [DOI] [PubMed] [Google Scholar]
- 23.Tretiak S, et al. Excitons and Peierls distortion in conjugated carbon nanotubes. Nano Lett. 2007;7:86–92. doi: 10.1021/nl0622000. [DOI] [PubMed] [Google Scholar]
- 24.Kilina S, Tretiak S. Excitonic and vibrational properties of single-walled semiconducting carbon nanotubes. Adv Funct Mater. 2007;17:3405–3420. [Google Scholar]
- 25.Tretiak S. Triplet state absorption in carbon nanotubes: A TD-DFT study. Nano Lett. 2007;7:2201–2206. doi: 10.1021/nl070355h. [DOI] [PubMed] [Google Scholar]
- 26.Zhao H, Mazumdar S, Sheng CX, Tong M, Vardeny ZV. Photophysics of excitons in quasi-one-dimensional organic semiconductors: Single-walled carbon nanotubes and π-conjugated polymers. Phys Rev B. 2006;73:075403. [Google Scholar]
- 27.Wang ZD, Zhao HB, Mazumdar S. Quantitative calculations of the excitonic energy spectra of semiconducting single-walled carbon nanotubes within a [1/4]-electron model. Phys Rev B. 2006;74:195406. [Google Scholar]
- 28.Uryu S, Ando T. Exciton absorption of perpendicularly polarized light in carbon nanotubes. Phys Rev B. 2006;74:155411. [Google Scholar]
- 29.Perebeinos V, Tersoff J, Avouris P. Radiative lifetime of excitons in carbon nanotubes. Nano Lett. 2005;5:2495–2499. doi: 10.1021/nl051828s. [DOI] [PubMed] [Google Scholar]
- 30.Shaver J, et al. Magnetic brightening of carbon nanotube photoluminescence through symmetry breaking. Nano Lett. 2007;7:1851–1855. doi: 10.1021/nl070260f. [DOI] [PubMed] [Google Scholar]
- 31.Gruneis A, et al. Inhomogeneous optical absorption around the K point in graphite and carbon nanotubes. Phys Rev B. 2003;67:165402. [Google Scholar]
- 32.Wang ZD, Zhao HB, Mazumdar S. ¼-electron theory of transverse optical excitons in semiconducting single-walled carbon nanotubes. Phys Rev B. 2007;76:115431. [Google Scholar]
- 33.Ajiki H, Ando T. Aharonov-Bohm effect in carbon nanotubes. Physica B. 1994;201:349–352. [Google Scholar]
- 34.Miyauchi Y, Oba M, Maruyama S. Cross-polarized optical absorption of single-walled nanotubes by polarized photoluminescence excitation spectroscopy. Phys Rev B. 2006;74:205440. [Google Scholar]
- 35.Lefebvre J, Finnie P. Polarized photoluminescence excitation spectroscopy of single-walled carbon nanotubes. Phys Rev Lett. 2007;98:167406. doi: 10.1103/PhysRevLett.98.167406. [DOI] [PubMed] [Google Scholar]
- 36.Fantini C, et al. Steplike dispersion of the intermediate-frequency Raman modes in semiconducting and metallic carbon nanotubes. Phys Rev B. 2005;72:085446. [Google Scholar]
- 37.Luo ZT, Papadimitrakopoulos F, Doorn SK. Intermediate-frequency Raman modes for the lower optical transitions of semiconducting single-walled carbon nanotubes. Phys Rev B. 2007;75:205438. [Google Scholar]
- 38.Tretiak S, Mukamel S. Density matrix analysis and simulation of electronic excitations in conjugated and aggregated molecules. Chem Rev. 2002;102:3171–3212. doi: 10.1021/cr0101252. [DOI] [PubMed] [Google Scholar]
- 39.Wu C, Malinin SV, Tretiak S, Chernyak VY. Exciton scattering and localization in branched dendrimeric structures Nat Phys. 2006;2:631–635. [Google Scholar]
- 40.Tretiak S, Saxena A, Martin RL, Bishop AR. Conformational dynamics of photoexcited conjugated molecules. Phys Rev Lett. 2002;89:097402. doi: 10.1103/PhysRevLett.89.097402. [DOI] [PubMed] [Google Scholar]
- 41.Shreve AP, et al. Determination of exciton-phonon coupling elements in single-walled carbon nanotubes by Raman overtone analysis. Phys Rev Lett. 2007;98:037405. doi: 10.1103/PhysRevLett.98.037405. [DOI] [PubMed] [Google Scholar]
- 42.Araujo PT, et al. Third and fourth optical transitions in semiconducting carbon nanotubes. Phys Rev Lett. 2007;98:067401. doi: 10.1103/PhysRevLett.98.067401. [DOI] [PubMed] [Google Scholar]
- 43.Dewar MJS, Zoebisch EG, Healy EF, Stewart JJP. Am1: A new general purpose quantum mechanical molecular model. J Am Chem Soc. 1985;107:3902–3909. [Google Scholar]
- 44.Scholes GD, et al. Low-lying exciton states determine the photophysics of semiconducting single wall carbon nanotubes. J Phys Chem C. 2007;111:11139–11149. [Google Scholar]
- 45.Luo Z, Papadimitrakopoulos F, Doorn SK. Bundling effects on the intensities of second-order Raman modes in semiconducting single-walled carbon nanotubes. Phys Rev B. 2008;77:035421. [Google Scholar]
- 46.Yarotski D, et al. Scanning tunneling microscopy of DNA-wrapped carbon nanotubes. Nano Lett. 2008 doi: 10.1021/nl801455t. in press. [DOI] [PubMed] [Google Scholar]
- 47.Zheng M, et al. DNA-assisted dispersion and separation of carbon nanotubes. Nat Mater. 2003;2:338–342. doi: 10.1038/nmat877. [DOI] [PubMed] [Google Scholar]
Associated Data
This section collects any data citations, data availability statements, or supplementary materials included in this article.


