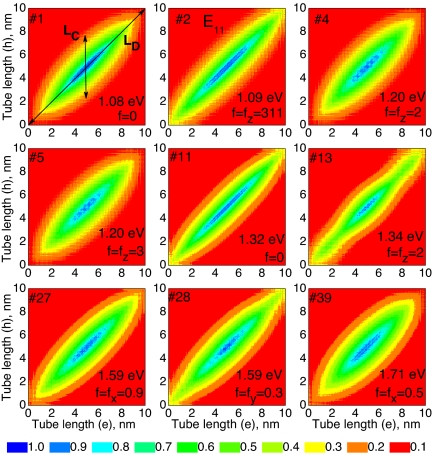
Fig. 2.
Excitonic transition density matrices of the (10,5) tube plotted in Cartesian coordinates. The first nine zero-node excitonic states are presented by two-dimensional contour plots as a function of the electron (vertical axis, nanometers) and hole (horizontal axis, nanometers) coordinates along the tube axis. The color code is presented at the bottom. Excitons are labeled according to their order number with respect to the ground state. The transition energy and the dominant oscillator strength component (f) are shown for each excitonic state. The strongly allowed optically active (bright) exciton is marked by E11. These plots reflect the distribution of the excitonic wavefunctions along the tube axis.

