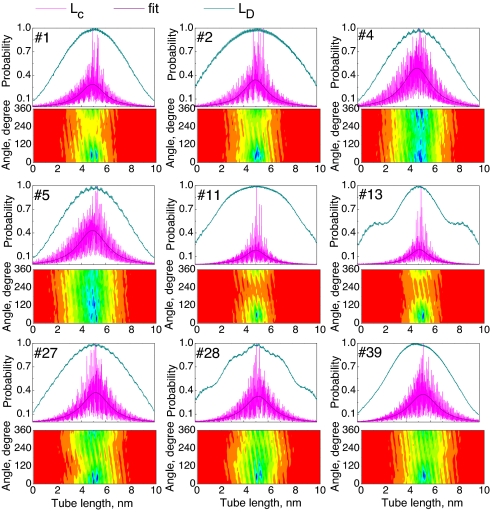
Fig. 3.
Delocalization properties of nine zero-node excitonic states of the (10,5) tube, characterizing excitonic wavefunction distribution along the tube axis (upper panels) and the tube circumference (lower panels). The diagonal slice (LD) of the transition density matrix represents the electron-hole pair center-of-mass position along the tube. Off-diagonal slices (LC) indicate the electron coordinate along the tube, when the hole is fixed in the middle, thus determining the maximal distance between an electron and a hole along the tube. This distribution is fitted by a Lorentzian function. The contour plots (lower panels) represent the probability of finding the electron on the tube circumference when the hole is fixed in the middle of the tube. This probability is a function of position of the electron along the tube axis (x-axis, nanometers) and the electron position along the tube circumference (y-axis, degrees), measured as an angle 0 < φi < 2π. The color scheme is given in Fig. 2.

