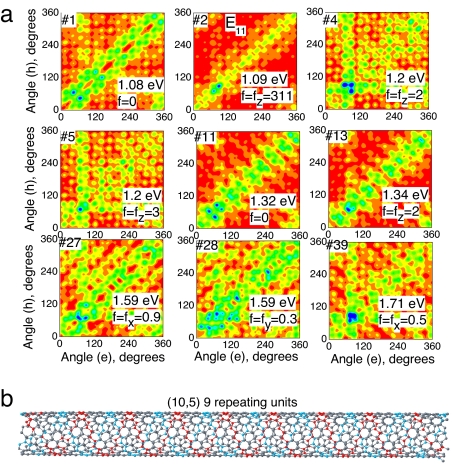
Fig. 5.
Representation of the transition density matrices in the helical tube coordinates. (a) Contour plots of the transition density matrices corresponding to nine excitons of the (10,5) tube shown in Figs. 2 and 3 in the helical coordinate system schematically shown at bottom and described by Eq. 1. Positions of the electron and hole are labeled with an azimuthal angle 0 < φi < 2π. The helical lines of the (10,5) tube are highlighted in red and cyan (orthogonal to the red line) on the tube surface. (b) Four excitons numbered 1, 2 (bright state), 11, and 13 show much stronger localization with respect to the tube circumference, compared with other states. These four excitons are attributed to parallel-polarized E11 transitions, whereas the others are cross-polarized E12 and E21 excitons. The color scheme is given in Fig. 2.

