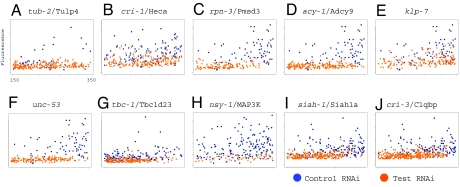
Fig. 1.
Identification of genes that regulate clec-85::gfp expression. Nematodes harboring the clec-85::gfp fusion were treated with the indicated dsRNAs. Depicted are overlay graphs comparing the test RNAi treatments (orange) and a control RNAi treatment (blue); each dot represents a single nematode. The x axis represents the time of flight or length of each animal in COPAS Biosort (Union Biometrica) units, and the y axis represents fluorescence due to the clec-85::gfp fusion. Individual graphs are from several different experiments.

