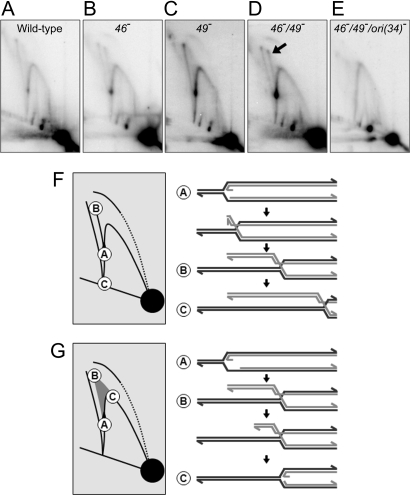
Fig. 4.
Replication intermediates from mutant infections. (A–E) The 2D gel image with maximum origin fork accumulation (9 min after infection) is shown for each phage infection indicated. Complete 2D gel time courses are shown in Fig. S1. (F and G) The 2D gel diagrams show the migration of origin forks undergoing regression (F) and regressed origin forks undergoing DSE degradation (G). The structures of different intermediates are shown with the corresponding 2D gel migration position indicated.

