Fig. 2.
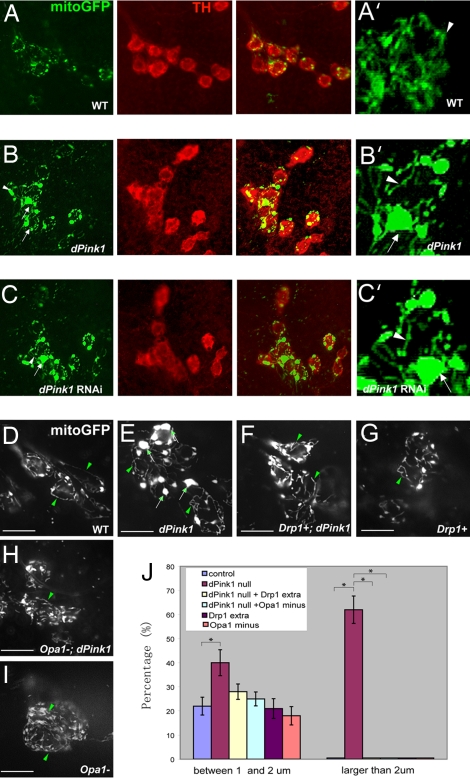
Up-regulation of mitochondrial fission prevents mitochondrial clustering in DA neurons caused by loss of dPink1. (A–C) Whole-mount immunostaining of dorsolateral protocerebral posterior (PPL1 or DL1) cluster DA neurons in 5- to 7-day-old adult flies of the following genotypes: TH-Gal4>UAS-mitoGFP (A), TH-Gal4>UAS-mitoGFP; dPink1B9 (B), and TH-Gal4>UAS-mitoGFP; UAS-dPink1 RNAi (C). (A–C) (Left) Immunostaining of GFP to monitor mitochondria. (Center) Immunostaining of TH to mark DA neurons. (Right) Merged images. (D–I) Live imaging of mitochondria by visualizing mitoGFP within the PPL1 cluster neurons in 5- to ≈7-day-old adult flies of the following genotypes: TH-Gal4>UAS-mitoGFP (D), TH-Gal4>UAS-mitoGFP; dPink1B9 (E), TH-Gal4>UAS-mitoGFP; dPink1B9; Drp1 extra copy (F), TH-Gal4>UAS-mitoGFP; Drp1 extra copy (G), TH-Gal4>UAS-mitoGFP; dPink1B9, Opa1-like/+ (H), and TH-Gal4>UAS-mitoGFP; Opa1-like/+ (I). A′, B′, and C′ show higher magnification views of the mitochondrial networks in A–C, respectively. Arrows, aggregated mitochondria; arrowheads, tubular mitochondria. (J) Quantification of the percentage of DA neurons containing mitochondrial aggregates with diameters of 1–2 or >2 μm. Note that mitochondrial aggregates >2 μm in diameter were observed almost exclusively in dPink1 mutant. *, P < 0.01, one-way ANOVA test.

