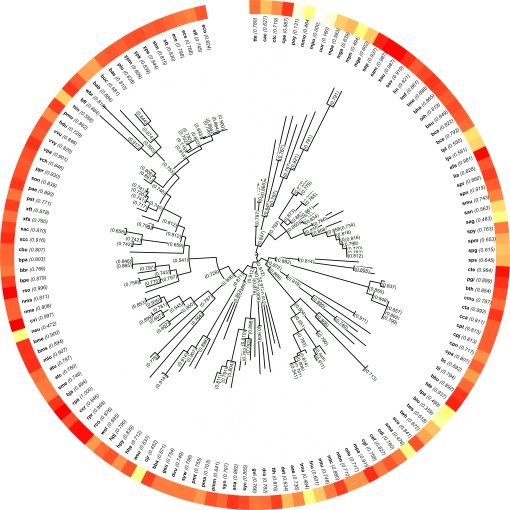
Fig. 1.
Modularity scores of bacterial metabolic networks across the tree of life of Ciccarelli et al. (21). The color scale indicates the range of modularity scores. Modularity scores are presented for both the 138 current species and 137 ancestral networks.

