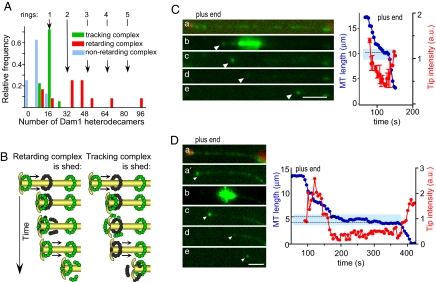
Fig. 2.
Shedding of Dam1 complexes under the depolymerization force. (A) Intensity histogram of tracking (in green, same data as in Fig. 1H) and MT wall-associated complexes that retard MT depolymerization (in red) or are collected without a significant change in the tracking rate (blue). (B) Two models to explain Dam1 shedding. Bleached rings are black. (C and D) Photobleaching of MT-associated Alexa488-Dam1 complexes (MT plus end cap is red, Alexa488-Dam1 is green). Target area (blue box in graphs) was illuminated with a 488-nm laser (b in C and D). Depolymerization paused in the bleached area, as is common in unbleached areas with dots, suggesting that photobleaching did not change these properties of the complexes. (Scale bars, 3 μm.) Arrowheads point to tip-associated complexes.

