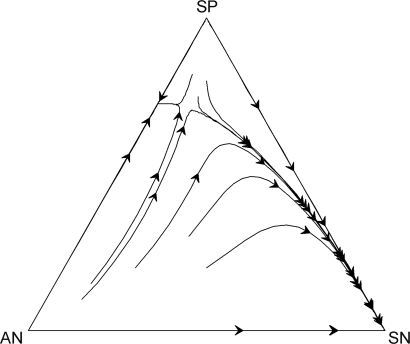
Fig. 6.
Triangle plot illustrating the population trajectories for altruistic nonpunishers (AN), selfish punishers (SP), and selfish nonpunishers (SN) at all possible initial frequencies. Each corner represents the population as that pure strategy. If selfish nonpunishers are sufficiently scarce, the population will settle at the selfish punisher–altruistic nonpunisher equilibrium point. Under conditions with a greater frequency of selfish nonpunishers, the population will be attracted to the selfish nonpunisher corner.

