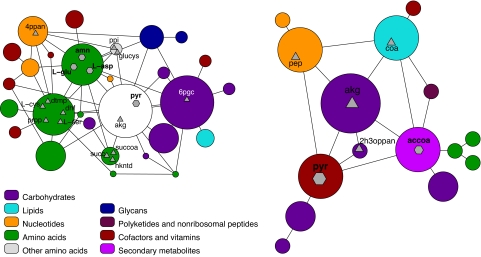
Fig. 1.
Mapping the metabolism of Escherichia coli. (Left) Map of a metabolic network of E. coli, which comprises 507 metabolites and 718 connections (11). The area of the circles is proportional to the number of metabolites in the corresponding module. The hexagons indicate connector hub metabolites, and the triangles indicate satellite connector metabolites. (Right) Map of the module containing pyruvate. The smaller symbols and fonts indicate roles at the second level in the hierarchy. 4ppan, d-4′-phosphopantothenate; amn, ammonia; L-glu, l-glutamate; L-asp, l-aspartate; ppi, diphosphate; glucys, γ-l-glutamyl-l-cysteine; L-cys, l-cysteine; L-ser, l-serine; dtmp, dTMP; dhf, 7,8-dihydrofolate; prpp, 5-phospho-α-d-ribose 1-diphosphate; pyr, pyruvate; akg, 2-oxoglutarate; succ, succinate; succoa, succinyl-CoA; hkntd, 2-hydroxy-6-ketononatrienedioate; 6pgc, 6-phospho-d-gluconate; pep, phosphoenolpyruvate; 2h3oppan, 2-hydroxy-3-oxopropanoate; accoa, acetoacetyl-CoA; coa, CoA. Figure courtesy of R. Guimerà and M. Sales-Pardo (both at Northwestern University).

