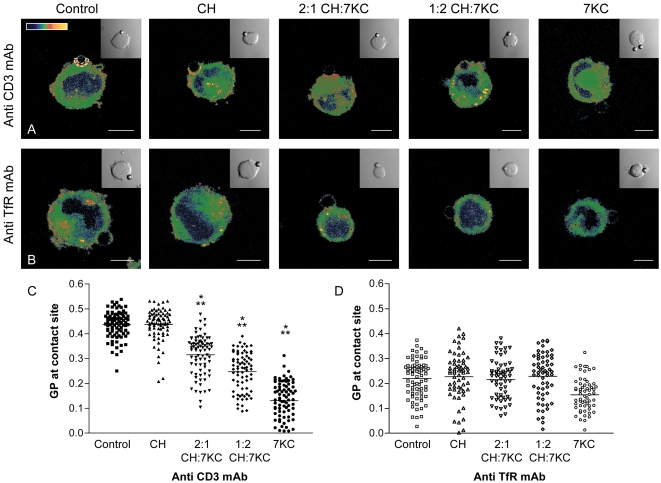
Figure 2. Membrane structure at activation sites in sterol-enriched T cells.
Sterol-enriched JCaM2 T cells were conjugated to polystyrene beads coated with anti-CD3 mAb (Anti CD3 mAb, A, C) or anti-transferrin receptor (Anti TfR mAb, B, D) for 7 min. A–B. Cell-bead conjugates were fixed, imaged and intensity image converted into GP images and pseudo-coloured (scale in A) as described previously. Inserts show the corresponding transmission image to identify the location of the bead. Bar 5 μm. C–D. GP values were measured over the entire contact area between cells and beads. Means (indicated by horizontal lines) and SDs are shown in Table 1. In C, differences (P<0.001) were found between the means of all conditions except between control versus cholesterol. No differences were found in D except between 7KC-treated cells and all other conditions (P<0.05). Difference of P<0.05 compared to control cells are marked with one asterisk; differences of P<0.05 to cholesterol-enriched cells with two asterisks.

