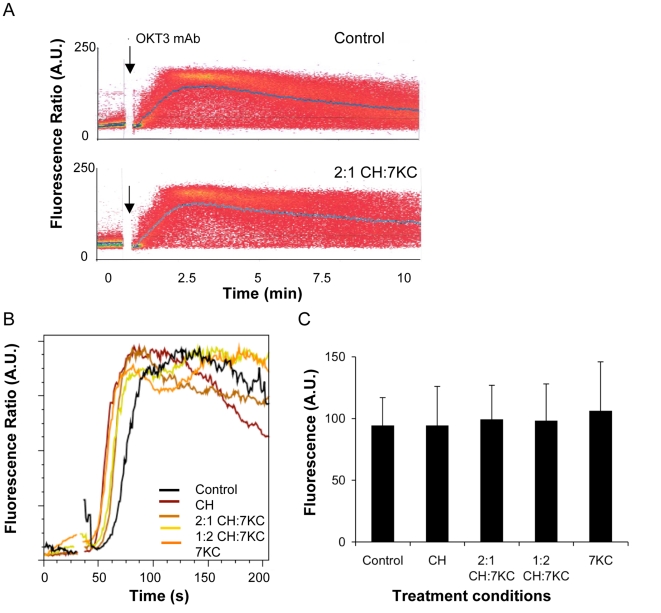
Figure 4. Calcium flux upon TCR triggering.
A. Jurkat cells (untreated controls or treated with 2:1 CH:7KC) were loaded with Indo-1 and evaluated for Ca2+ mobilization by stimulation with 5 μg OKT-3 (anti-CD3 mAb) after 60 s (see arrow). The mean Ca2+ flux is indicated by the blue lines. B. Mean calcium mobilization upon TCR triggering for the indicated sterol conditions. C. Maximum fluorescence intensity of Fluo-4-labeled Jurkat cells (15–40 cells per condition) stimulated anti-CD3-mAb adhered to microscopy coverslips. No differences between cell conditions were found (P>0.05).

