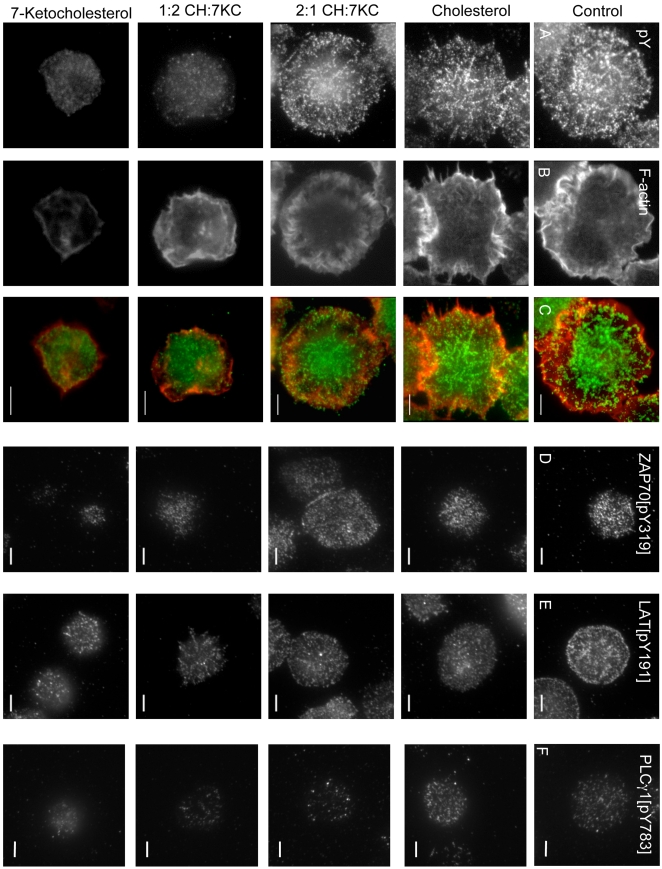
Figure 7. TIRF microscopy images of TCR activation sites of sterol-enriched T cells.
Sterol-treated Jurkat cells were activated for 10 min on anti-CD3 mAb-coated glass coverslips, fixed and stained for phosphotyrosine (pY, A), phalloidin (B), ZAP70 phosphorylated at tyrosine 319 (D), LAT phosphorylated at tyrosine 191 (E) or PLCγ1 phosphorylation at tyrosine 783 (F). T cell activation sites were imaged by TIRF microscopy with a penetration depth of ∼100 nm. Panel C show the merged images with pY in green and F-actin in red. Bar 5 μm.

