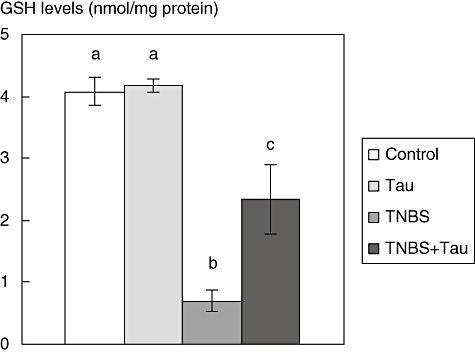
Fig. 5.

Glutathione levels in the colon tissue of control, taurine (Tau)-, 2,4,6-trinitrobenzene sulphonic acid (TNBS)- and TNBS plus taurine (TNBS + Tau)-treated rats. Each value is expressed as mean ± standard deviation. Values not sharing a common superscript letter are significantly different by Kruskal–Wallis test (P < 0.05).
