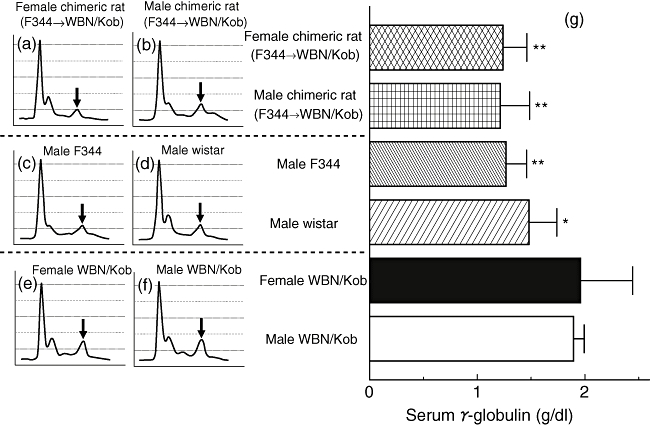
Fig. 4.

Analyses of serum γ-globulin. Sera were collected from male and female Wistar Bonn/Kobori (WBN/Kob) rat (4 months of age) and electrophoresis was carried out to examine the relative level of IgG. (a) Female WBN/Kob rat treated with intrabone marrow–bone marrow transplantation (IBM–BMT) from F344 (F344→Kob); (b) male WBN/Kob rat treated with IBM–BMT from F344 (F344→WBN/Kob); (c) male F344 rat as a normal control; (d) male Wistar rat as a normal control; (e) untreated female WBN/Kob rat; (f) untreated male WBN/Kob rat; and (g) amounts of γ-globulin in sera calculated from the results of electrophoresis and total amounts of serum protein. Columns and bars represent means ± standard deviations of seven rats. *P < 0·05; **<0·01.
