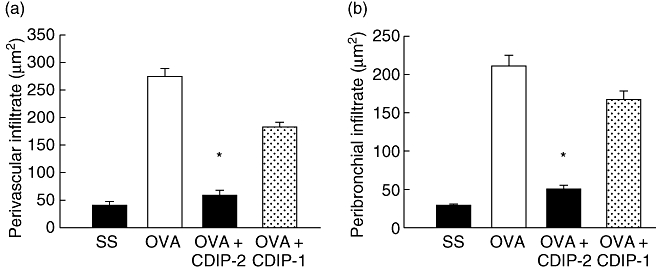
Fig. 6.

Quantitative analysis of inflammatory cells in haematoxylin and eosin-stained lung tissues. Quantitative analysis of the recruited inflammatory cells in the (a) perivascular and (b) peribronchial regions. Cell infiltrate area (μm2) from selected areas is shown in the histograms and analysed as described in Methods. A representative experiment is shown (n = 5) (*P < 0·001).
