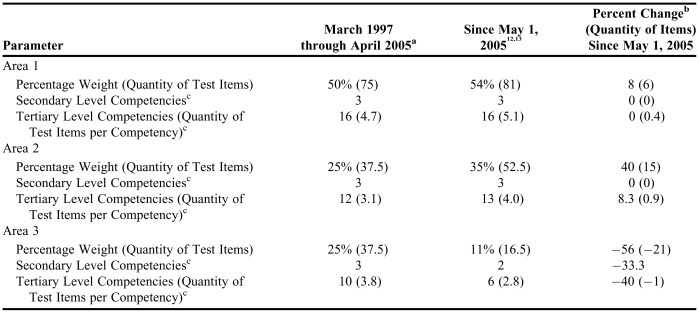
Table 3.
Percentage Weighting Comparison of NAPLEX Blueprints From March 1997 Through April 2005 and Since May 1, 2005
aValues for the March 1997 – April 2005 Blueprint were obtained from the NAPLEX Competency Statements, which were previously publicly accessible from the National Association of Boards of Pharmacy
b([Since May 1, 2005 value – March 1997 through April 2005 value]/March 1997 through April 2005 value) × 100
cThe quantities of items listed for each secondary and tertiary Blueprint Competency Area or level are approximate, and vary slightly according to the CAT NAPLEX algorithm. Quantity = (Primary Area or level percentage weighting/100) × 150 items

