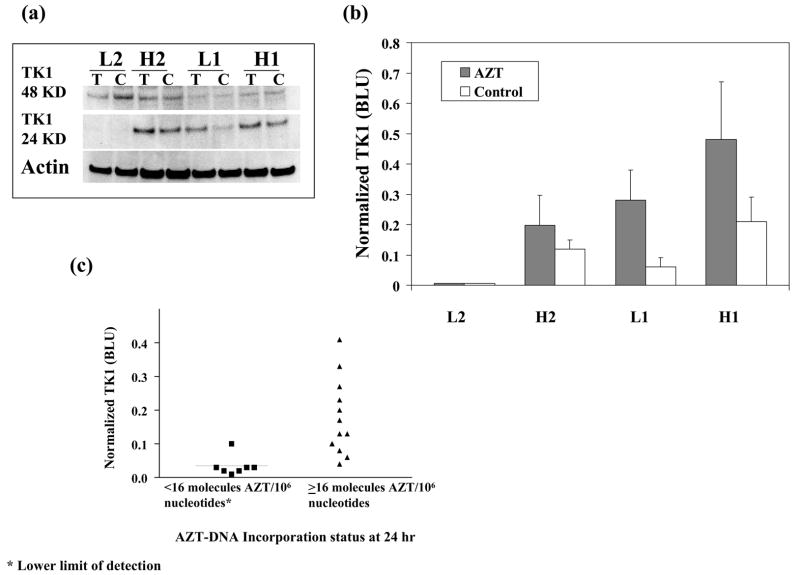
Figure 3.
(a) Representative Western blot, using a TK1 antibody, for cytoplasmic extracts of NHMECs H1, H2, L1 and L2 exposed to 0 (labeled C) or 200μM AZT (labeled T) for 24 h. The inactive dimeric (48 KD) and active monomeric (24 KD) forms of TK1 are shown in the upper rows, while the housekeeping protein actin is shown in the bottom row. (b) Normalized luminescence values for the data shown in Figure 3a, where the clear bars represent unexposed cells and the grey bars represent cells exposed to AZT. (c) Scatter plot for TK1 values (BLUs), obtained by normalized luminescence quantification, for the 19 NHMECs strains exposed to 200 μM AZT and grouped by capacity to incorporate AZT into DNA at 24 h. Cells with fewer than 16 molecules of AZT/106 nucleotides, the assay LOD, were grouped together and compared to those with ≥16 molecules of AZT/106 nucleotides. The mean BLU value (solid line on figure) ∀ SE for strains that have measurable AZT-DNA incorporation at 24 h was 0.18 ∀0.03 (n=12), compared to 0.03 ∀ 0.01 (n=7) for strains that have no measurable AZT-DNA incorporation at 24 h. The median BLU values were at 0.15 and 0.02 and the difference between the strains with ability to incorporate AZT (≥16 molecules of AZT/106 nucleotides) and those without it (<16 molecules of AZT/106 nucleotides) was statistically significant (p= 0.0005, Mann-Whitney test).

