
Fig. 4.
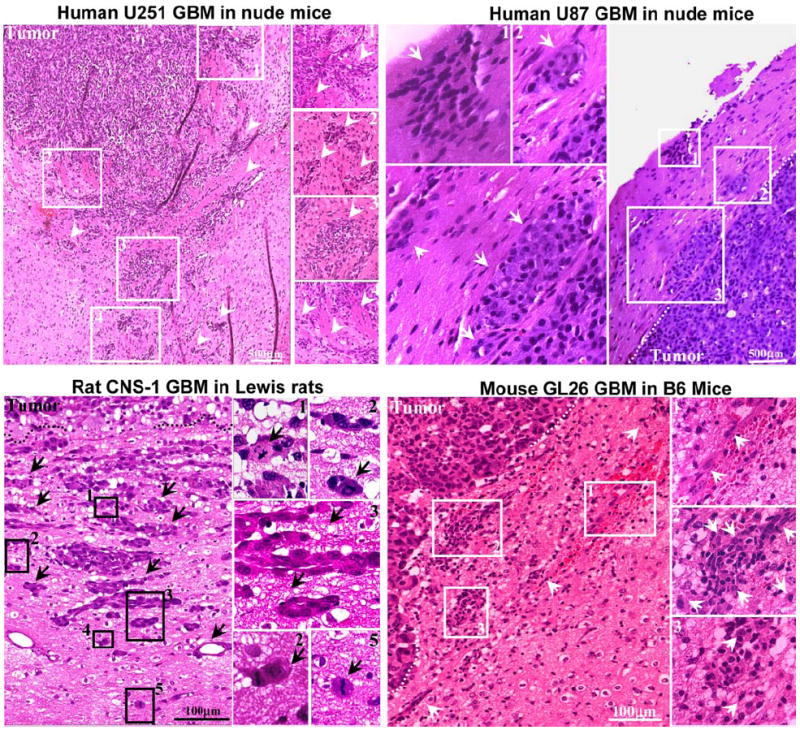
Neoplastic cellular infiltration into surrounding non-neoplastic brain tissue in syngeneic rat (CNS-1) and mouse (GL26) GBM models and human glioma xenografts in nude mice (U251 and U87). Paraffin sections (5 μm) from GBM were stained with hematoxylin and eosin for evaluating neoplastic invasion. The numbers in low-magnification microphotographs depict areas magnified in the microphotographs on the right. Arrows indicate malignant cells, clusters of GBM cells, and tumoral blood vessels infiltrating surrounding brain parenchyma. The indistinct tumor borders and the malignant cells clearly entering the non-neoplastic brain tissue suggest an invasive phenotype