
FIGURE 3. Dissociation of hemin from IsdA and IsdC.
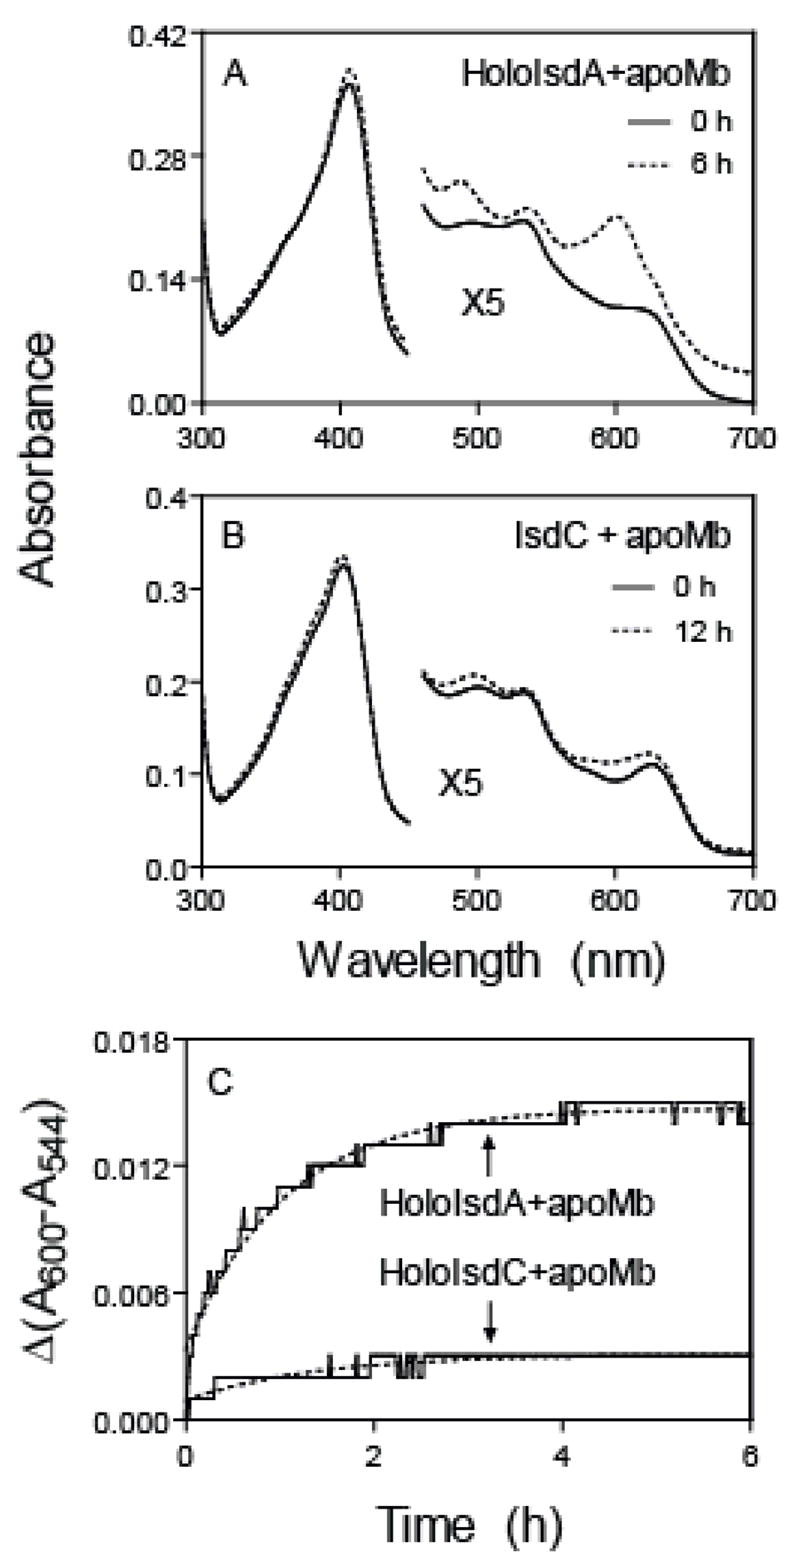
HoloIsdA or holoIsdC at 3 μM was incubated with 48 μM H64Y/V68F apomyoglobin in 20 mM Tris-HCl, pH 8.0, at 25°C. A and B, spectra of the mixture at 0 h and 6 or 12 h after mixing. C, time courses of Δ(A600-A544) in these reactions of hemin dissociation. The grey lines are the theoretical curves obtained by fitting the data to a single exponential equation.