
FIGURE 4. Efficient hemin transfer from holoIsdA to apoIsdC.
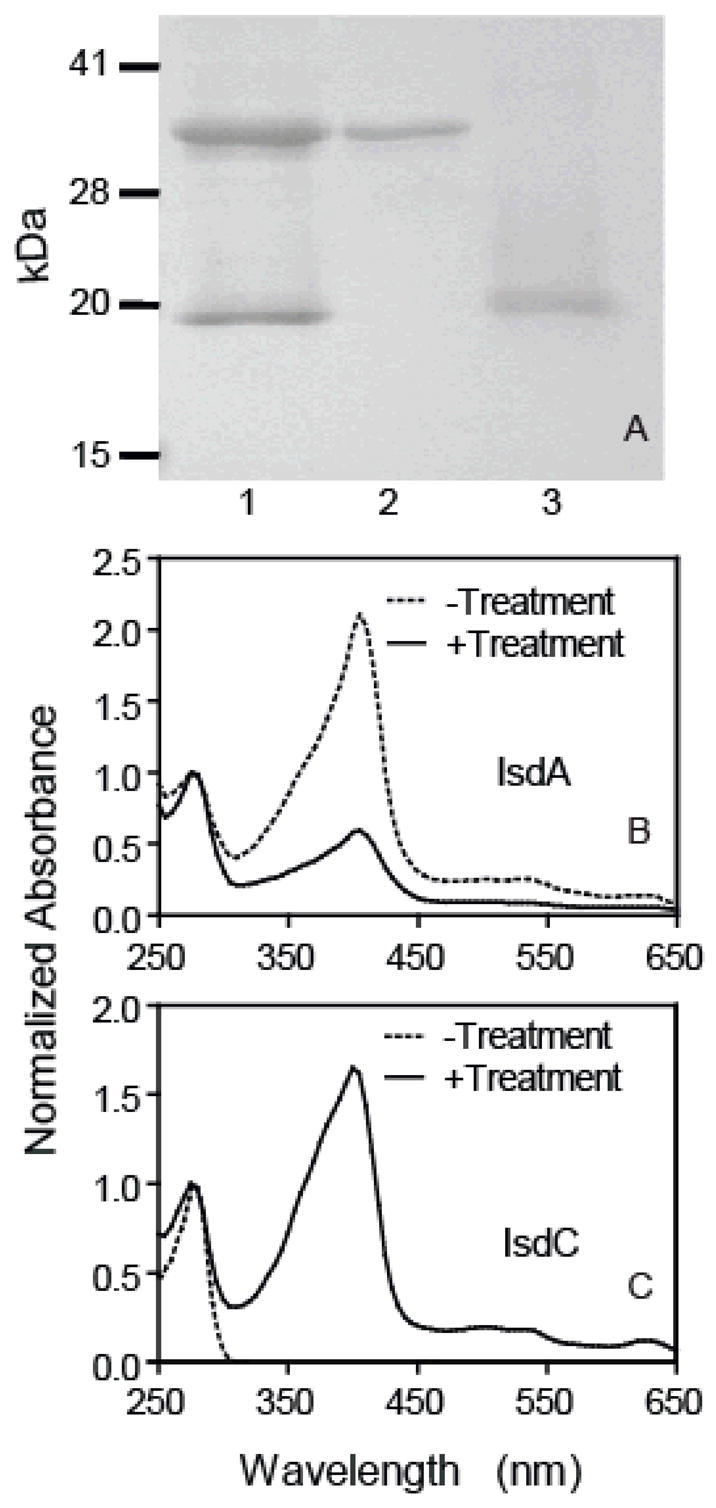
ApoIsdC (47 μM) was incubated with 36 μM holoIsdA in 0.1 ml of 20 mM Tris-HCl, pH 8.0, at room temperature for 2 min. The two proteins were separated as described in the text. A, SDS-PAGE analysis showing separation of IsdA and IsdC from their mixture. Lanes: 1, holoIsdA/apoIsdC mixture before separation; 2, IsdA isolated from the mixture; 3, IsdC isolated from the mixture. B, spectra of holoIsdA (dashed curve) and treated IsdA (solid curve). C, spectra of apoIsdC (dashed curve) and treated IsdC (solid curve).