
FIGURE 6. ApoIsdC titration in hemin transfer from holoIsdA to apoIsdC.
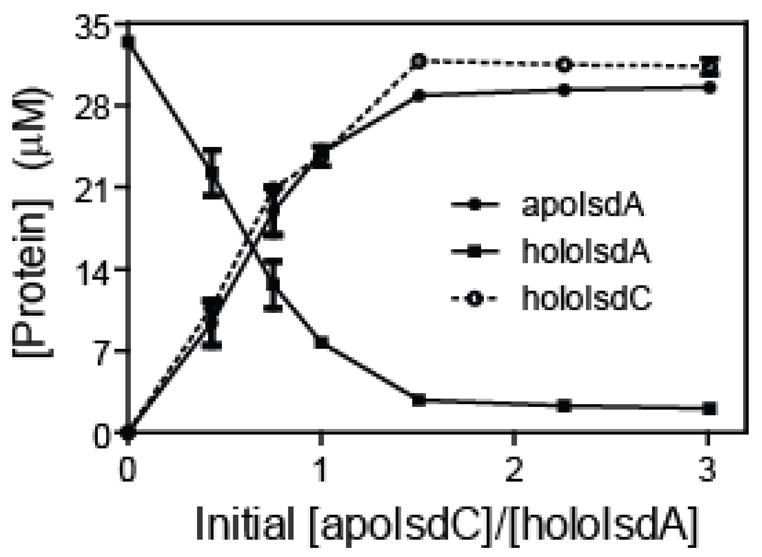
HoloIsdA (33 μM) was incubated with 12, 24, 48, 71, or 95 μM apoIsdC in 20 mM Tris-HCl, pH 8.0, at 22°C for 20 min. Shown are the concentrations of holoIsdA, apoIsdA, and holoIsdC in the mixtures as a function of the ratio of initial [apoIsdC]/[holoIsdA].