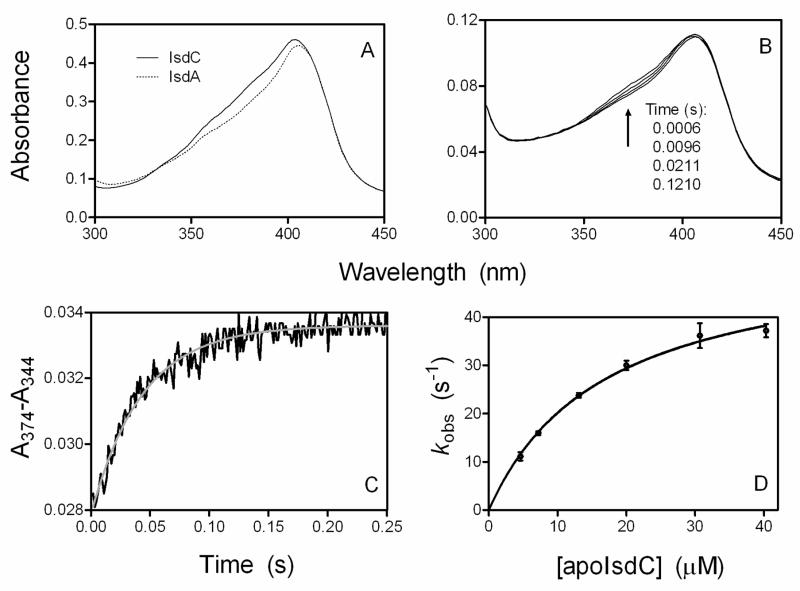
FIGURE 7. Spectral evidence for and kinetics of direct hemin transfer from holoIsdA to apoIsdC.
A, comparison of the spectra of 4.5 μM holoIsdA and holoIsdC in 20 mM Tris-HCl, pH 8.0. B, absorption spectra of a mixture of 1.3 μM holoIsdA and 7.4 μM apoIsdC as a function of time after mixing in a stopped-flow spectrophotometer. C, time course of A374-A344 for the reaction in panel B. The black trace and grey curve represent the observed data and single exponential fitting curve, respectively. D, the observed rate constant plotted as a function of [apoIsdC]. The rate constants at different [apoIsdC] were obtained from single exponential fitting as in C, and the curve is the theoretical curve obtained by fitting the data to Equation 2.

