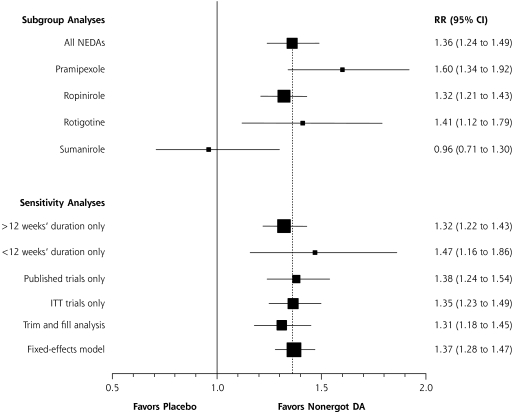
Figure 3.
Subgroup and sensitivity analyses of nonergot dopamine agonists evaluating response to Clinical Global Impression-Improvement scale.
CI=confidence interval; DA = dopamine agonists; ITT = intention to treat; NEDA = nonergot dopamine agonist; RR = relative risk.
Note: The dashed vertical line represents the combined treatment effect for the original analysis.

