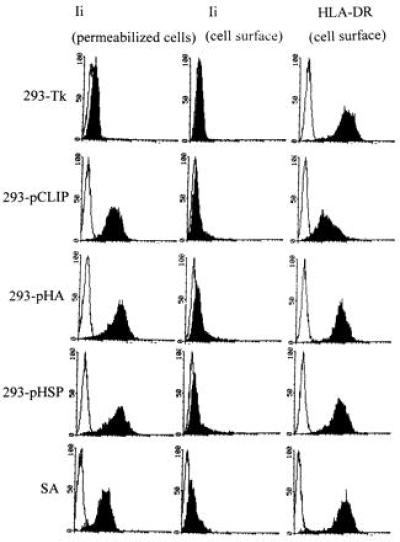
Figure 2.

FACS analysis of the transfectants. Transfectants 293-pHA, 293-pCLIP, and 293-pHSP and control transfectant 293-Tk were screened for intracellular invariant chain expression (first column), as well as for cell surface expression of HLA-DR (third column) and invariant chain (second column). For reference, the EBV-transformed B cell line SA was also analyzed. Open areas indicate background staining.
