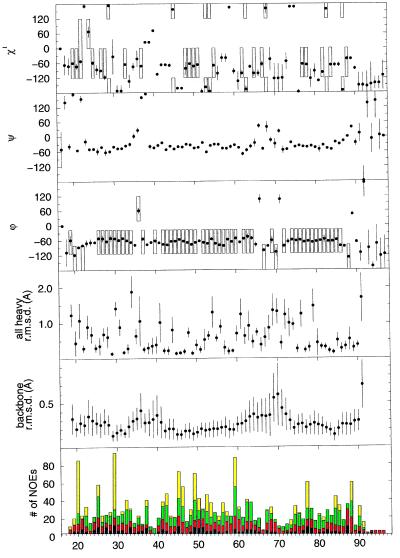
Figure 1.
The structural parameters for the 20 presented structures of RAPd1T. The deviations are taken to an average structure and the vertical bars correspond to one SD. In the panels displaying the dihedral angle data for φ, ψ, and χ1 the frames show the applied dihedral angle constraints. The average structure is calculated from residue 19 to 91. The NOE display shows the number of intra (black bar), sequential (red), medium-range (green), and long-range (yellow) NOEs assigned to protons of the residues.

