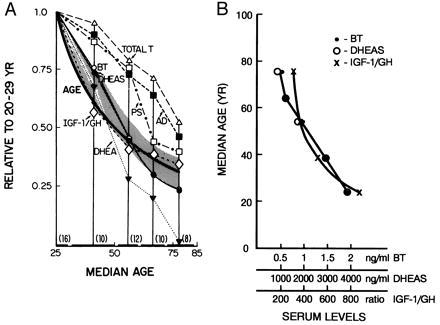
Figure 1.

Stepwise age-related changes. (A) The age curve was obtained by plotting the median age of a particular cohort (Table 2) vs. median age of the 20–29-yr cohort/median age of the particular cohort. The curves for the biochemical variables were obtained by plotting the median age of a particular cohort vs. the mean value (ng/ml) for the variable in the cohort/the mean value for the 20–29-yr cohort. (B) Plot of the actual serum values of BT, DHEAS, and IGF-1/GH as a function of median age of the cohort.
