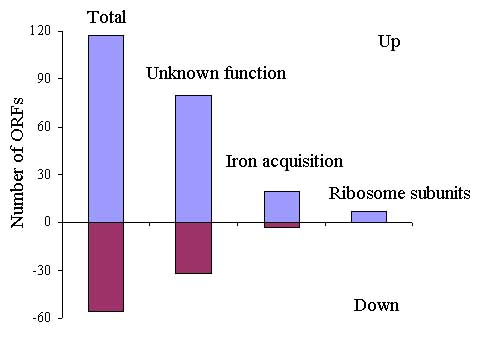
Figure 4.

Up-expressed (up) and down-expressed (down) genes (|log3 ratio| ≥1 with p<0.05) in the fur mutant versus MR-1. The leftmost bar is the total number of up-expressed and down-expressed genes. Genes are grouped according to the function categories, as indicated by text.
