Figure 1.

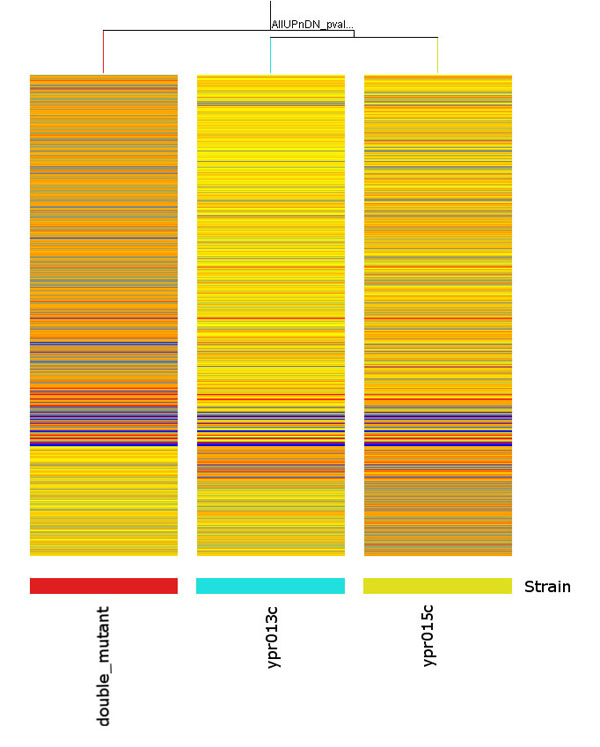
Condition tree for all significantly UP and Down-regulated genes, total 562 genes. Orange represents up and blue represent down-regulated genes.

Condition tree for all significantly UP and Down-regulated genes, total 562 genes. Orange represents up and blue represent down-regulated genes.