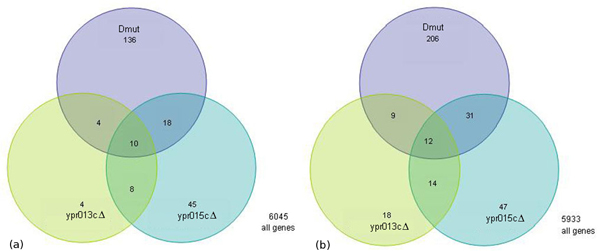
Figure 3.

Venn diagrams for genes whose expression was significantly altered in the single mutants and in the double mutant. Green indicated genes whose expressions were altered in ypr013cΔ, blue in ypr015cΔ and violet in ypr013cΔypr015cΔ. (a), Overlapped up-regulated genes, and (b), Overlapped down-regulated genes.
